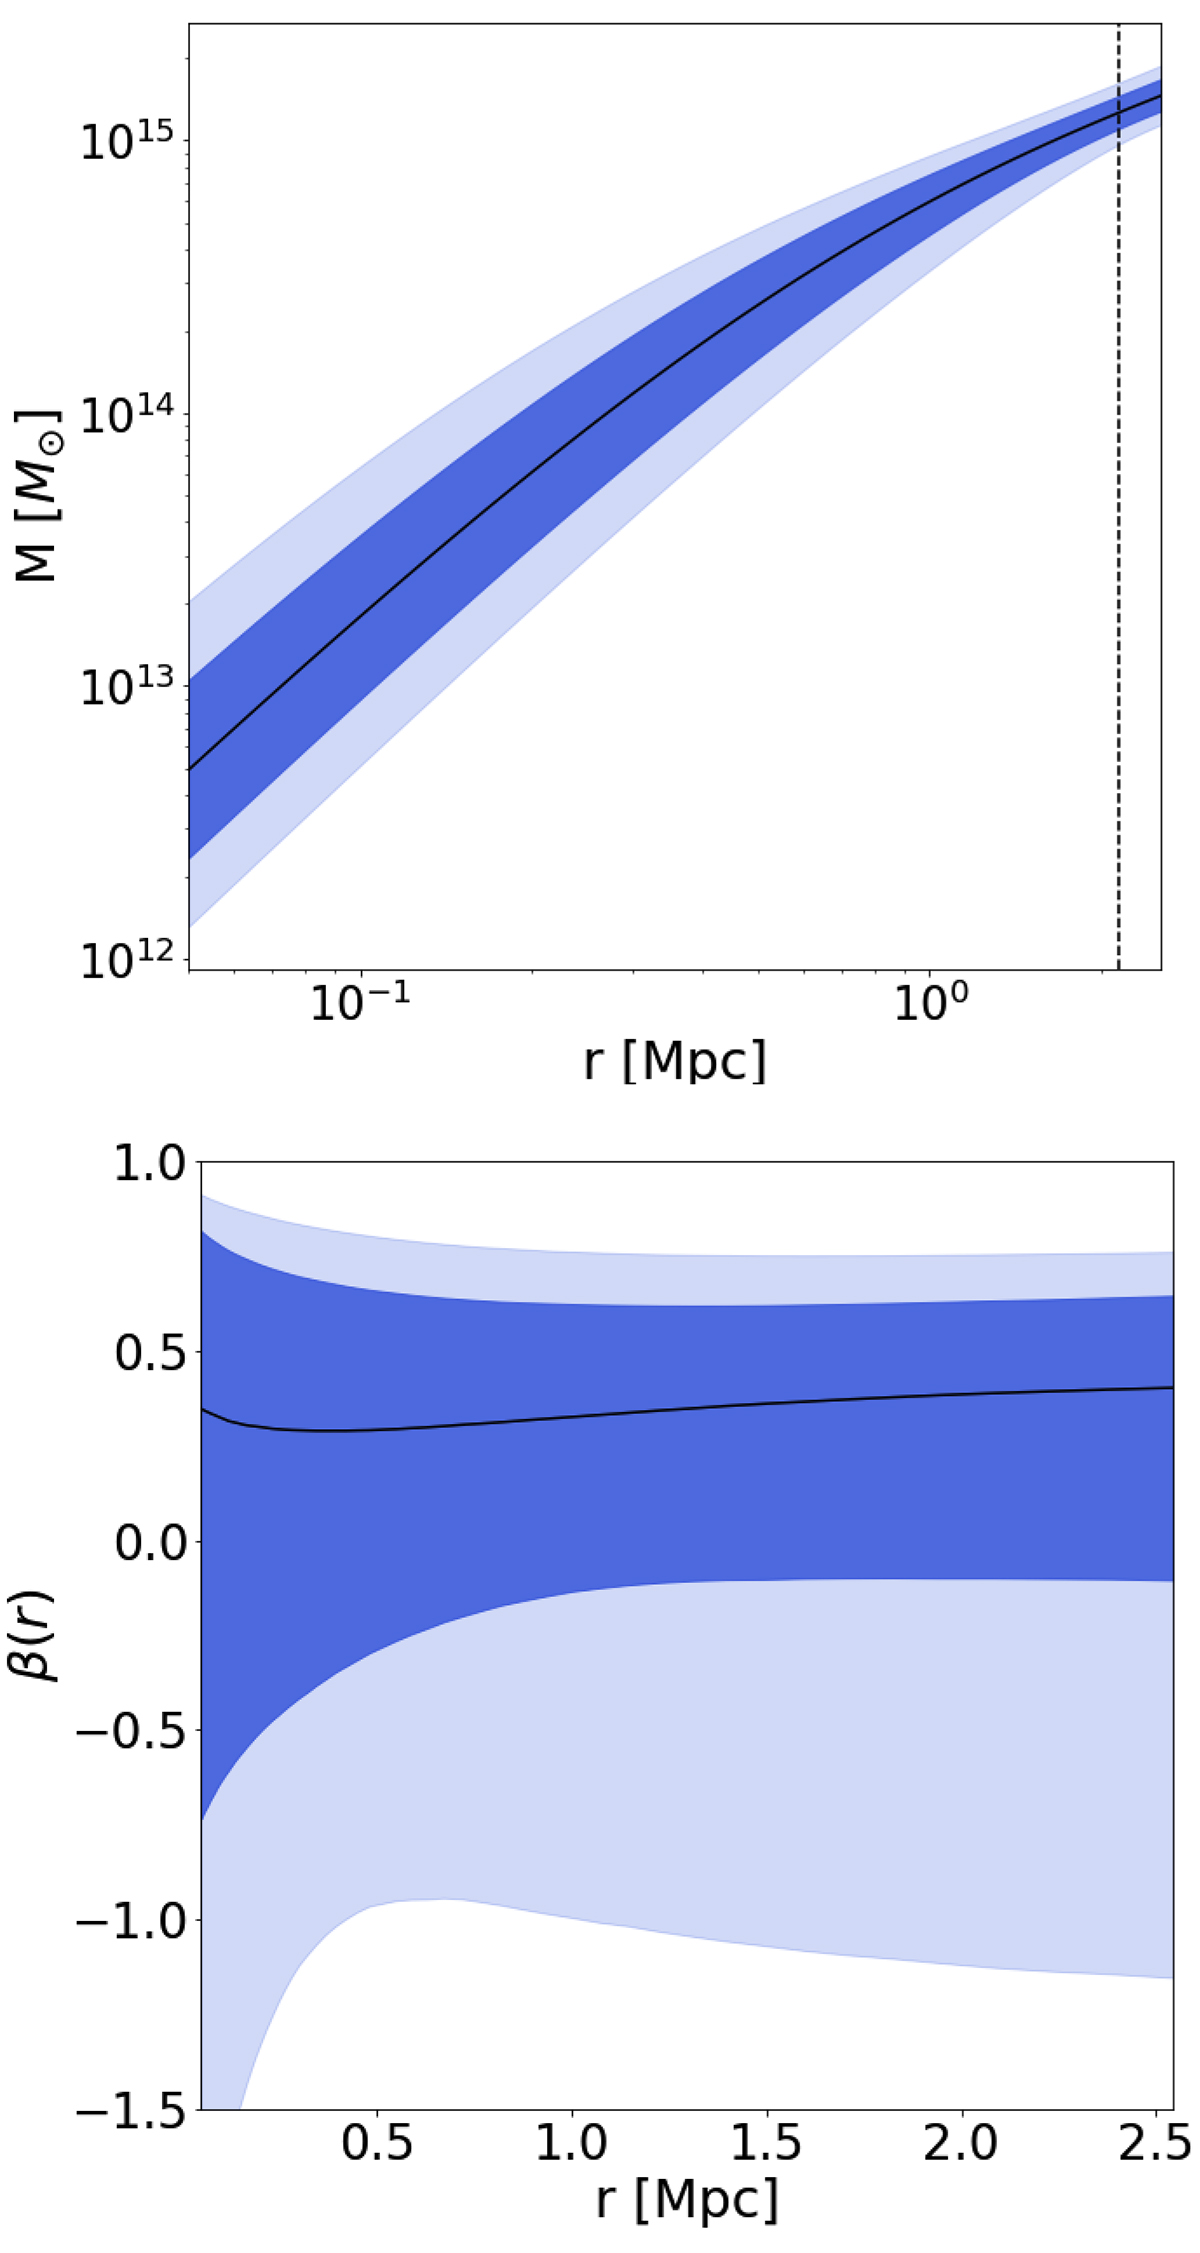
Fig. 2.
Download original image
Mass profile (top) and radial velocity anisotropy profile (bottom) of the cluster PSZ2 G067.17+67.46, as obtained via the MG-MAMPOSST analysis with Ngal = 299 galaxies and adopting a NFW model and a gT model, respectively. In both plots, darker and lighter shaded regions refer to 68% and 95% CLs, respectively. The vertical dashed line in the top panel identifies the best fit for r200 = 2.19 Mpc.
Current usage metrics show cumulative count of Article Views (full-text article views including HTML views, PDF and ePub downloads, according to the available data) and Abstracts Views on Vision4Press platform.
Data correspond to usage on the plateform after 2015. The current usage metrics is available 48-96 hours after online publication and is updated daily on week days.
Initial download of the metrics may take a while.