Open Access
Fig. C.1.
Download original image
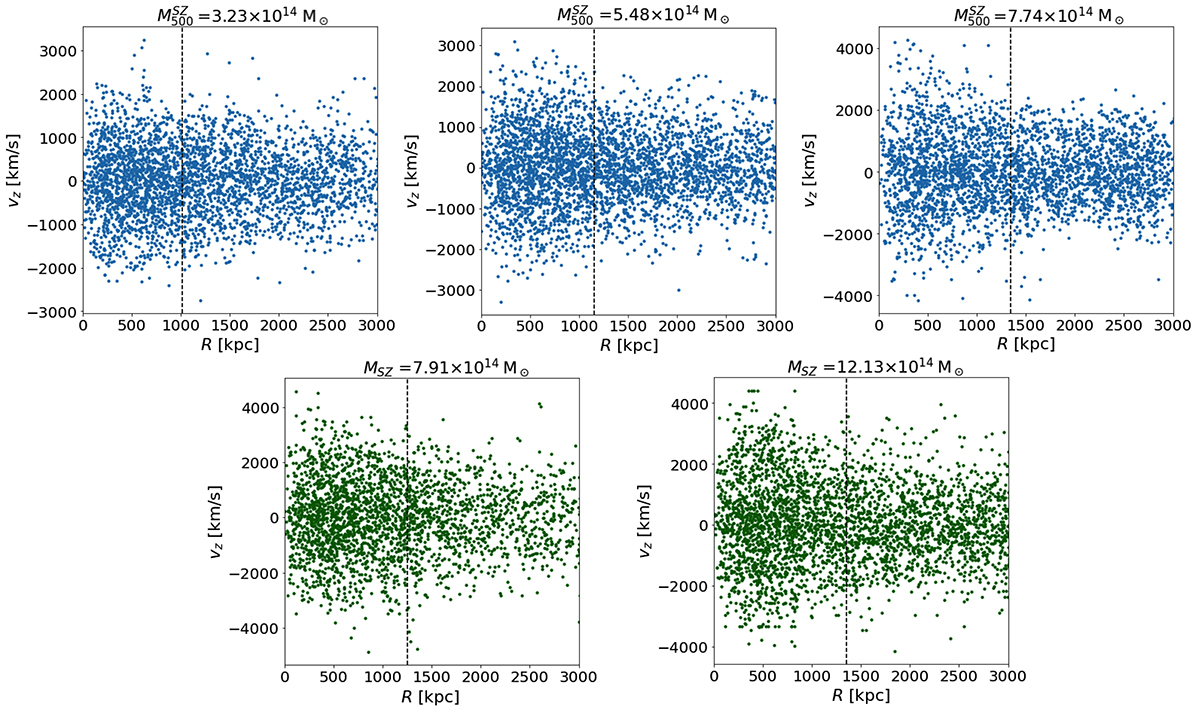
PPS parameters (radius, R, and radial velocity, v) for the SZ-stacked clusters. Top, blue points: T1. Bottom, green points: T2. The vertical dashed lines indicate the average r500 of all the clusters in each stacking.
Current usage metrics show cumulative count of Article Views (full-text article views including HTML views, PDF and ePub downloads, according to the available data) and Abstracts Views on Vision4Press platform.
Data correspond to usage on the plateform after 2015. The current usage metrics is available 48-96 hours after online publication and is updated daily on week days.
Initial download of the metrics may take a while.