Open Access
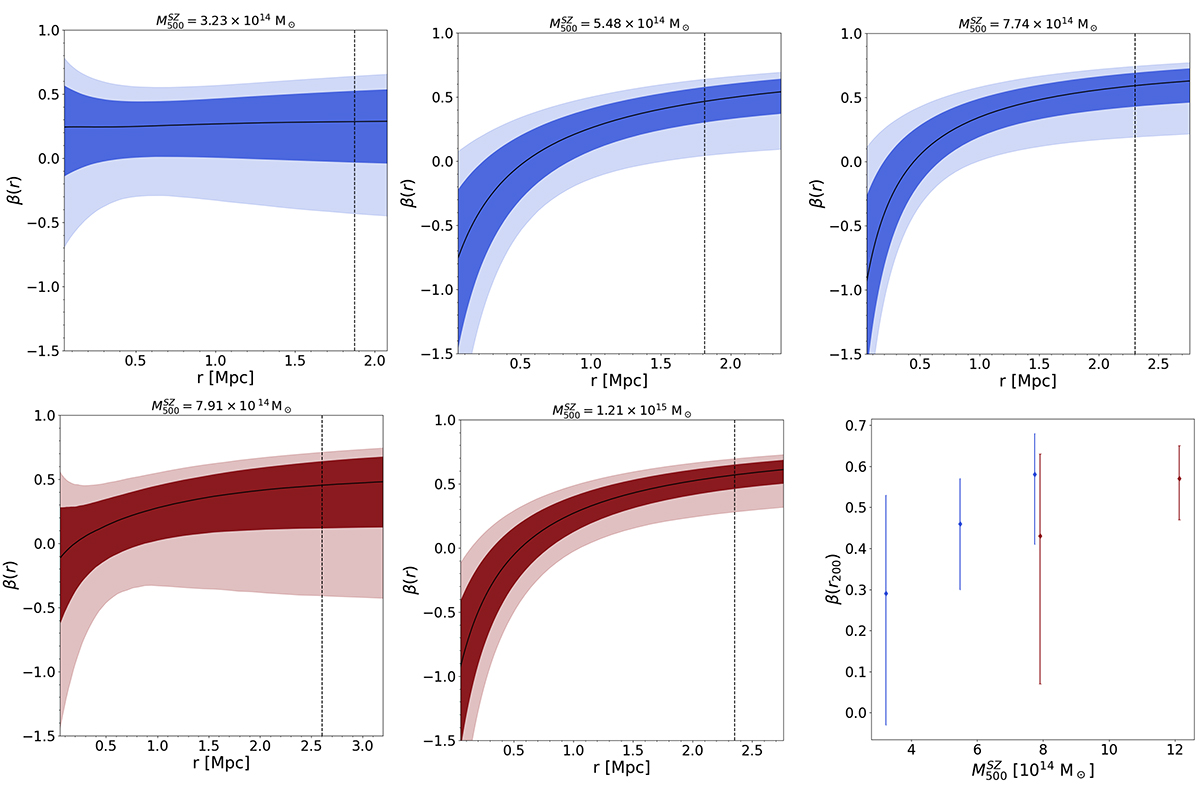
Fig. 12.
Download original image
Radial velocity anisotropy profiles for the stacked clusters, where the stacking is in bins of ![]() . The structure is exactly as in Fig. 11. In all plots, the vertical dashed lines indicate r500 as obtained from the average
. The structure is exactly as in Fig. 11. In all plots, the vertical dashed lines indicate r500 as obtained from the average ![]() of the corresponding mass bin.
of the corresponding mass bin.
Current usage metrics show cumulative count of Article Views (full-text article views including HTML views, PDF and ePub downloads, according to the available data) and Abstracts Views on Vision4Press platform.
Data correspond to usage on the plateform after 2015. The current usage metrics is available 48-96 hours after online publication and is updated daily on week days.
Initial download of the metrics may take a while.