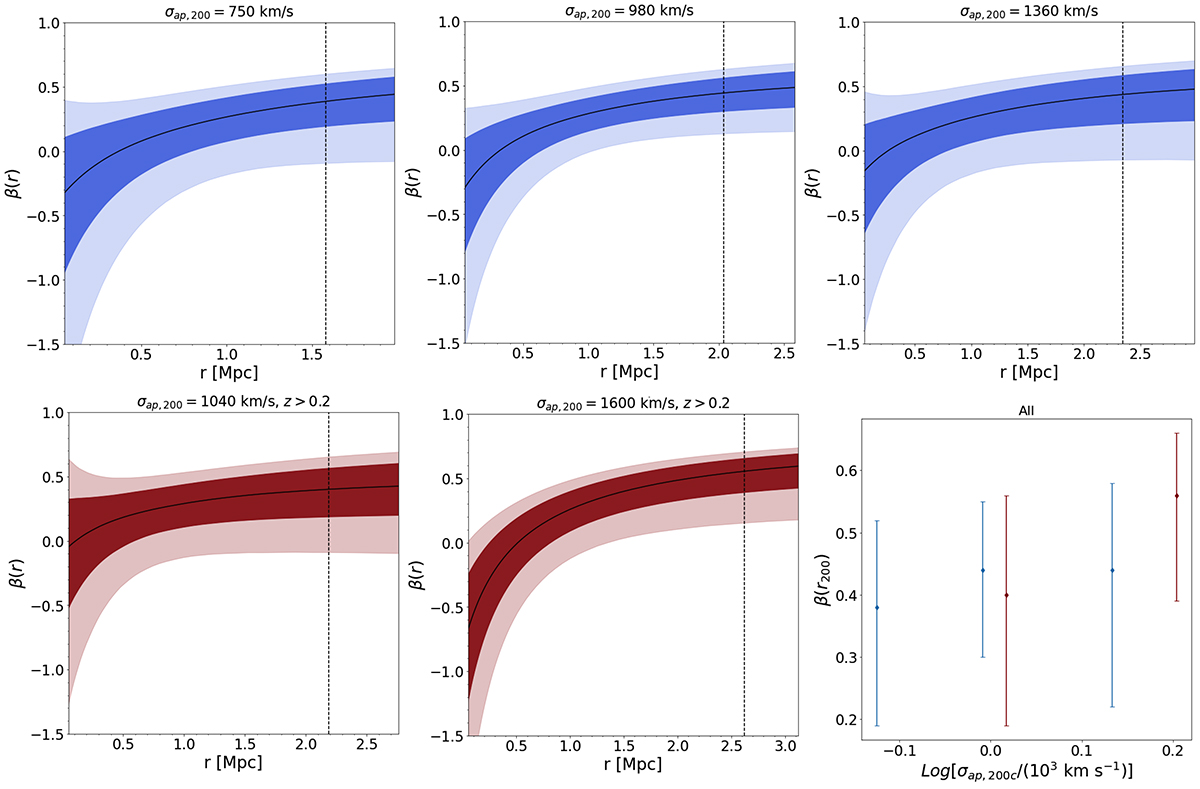
Fig. 11.
Download original image
Radial velocity anisotropy profiles for stacked clusters, where the stacking is in velocity dispersion. The bands show the 68% and 95% regions, and the black curve is the median profile. Top: z < 0.2. Bottom: z > 0.2. The bottom-right plot shows the value of β(r = r200) with 68% error bars (blue and red for z < 0.2 and z > 0.2, respectively). In all plots, the vertical dashed lines indicate the average rap, 200 in the corresponding velocity dispersion bin.
Current usage metrics show cumulative count of Article Views (full-text article views including HTML views, PDF and ePub downloads, according to the available data) and Abstracts Views on Vision4Press platform.
Data correspond to usage on the plateform after 2015. The current usage metrics is available 48-96 hours after online publication and is updated daily on week days.
Initial download of the metrics may take a while.