Fig. 4.
Download original image
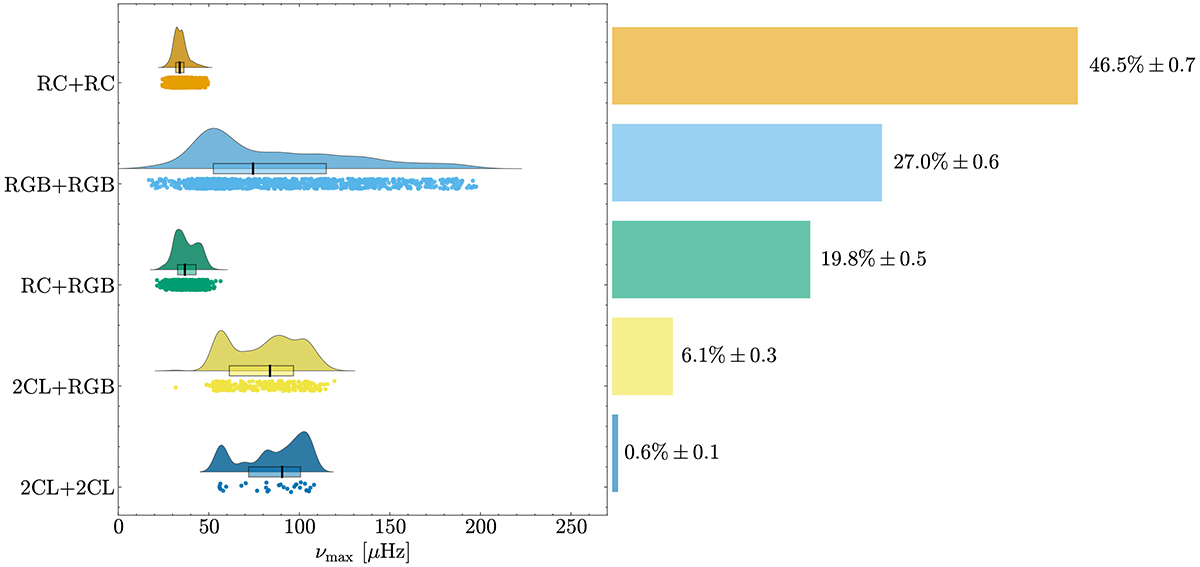
νmax distribution of AABs, with various evolutionary stage combinations of binary components. Below each smoothed curve (normalized to the unit area), a box shows the interquartile range (the 25th to 75th percentiles), with a vertical black line indicating the median. The bar chart on the right shows the percentage of different combinations with their standard deviations.
Current usage metrics show cumulative count of Article Views (full-text article views including HTML views, PDF and ePub downloads, according to the available data) and Abstracts Views on Vision4Press platform.
Data correspond to usage on the plateform after 2015. The current usage metrics is available 48-96 hours after online publication and is updated daily on week days.
Initial download of the metrics may take a while.