Fig. 3.
Download original image
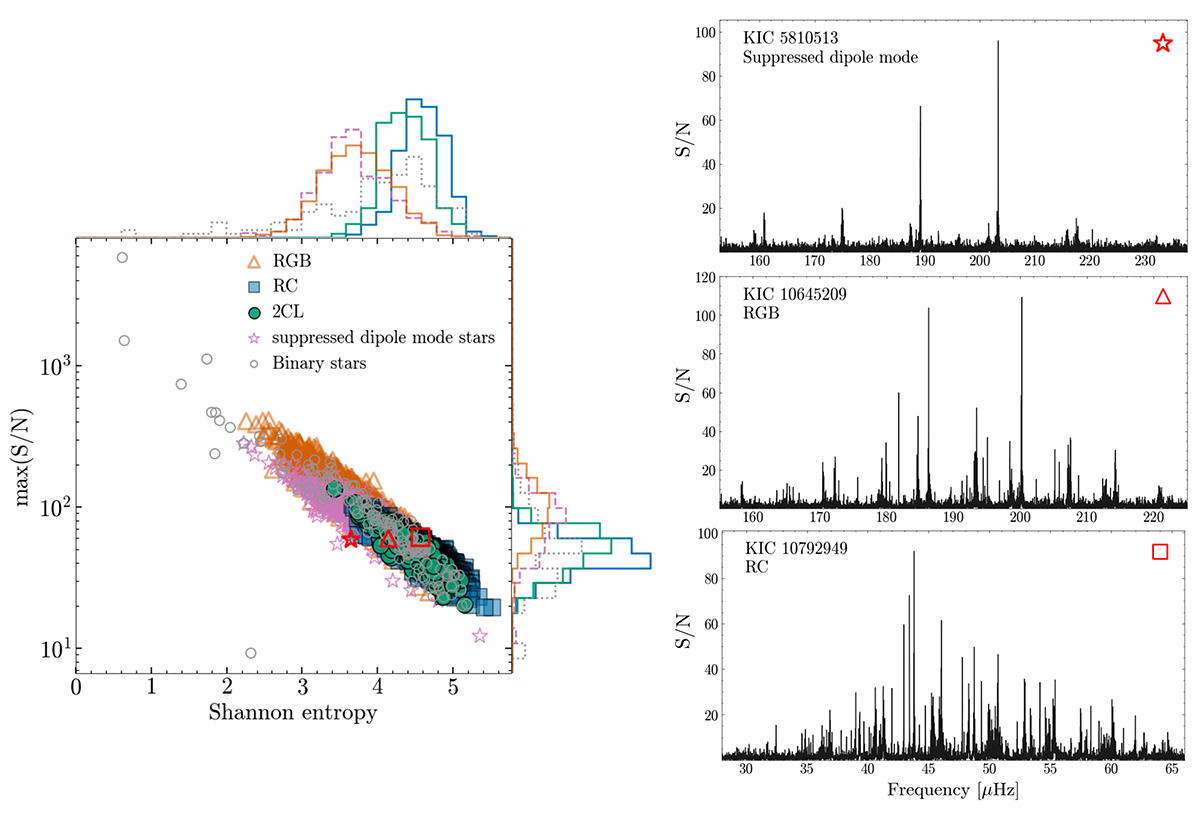
Maximum S/N versus entropy of the background-normalized PDS for 3212 observed red-giant stars, with the y axis plotted on a logarithmic scale. Known binary stars are shown as gray circle (see Sect. 2 for more details of this set of stars). The panels on the right show the background-normalized PDSs corresponding to specific red symbols marked on the left panel. These PDS figures highlight the characteristics associated with their different entropy levels.
Current usage metrics show cumulative count of Article Views (full-text article views including HTML views, PDF and ePub downloads, according to the available data) and Abstracts Views on Vision4Press platform.
Data correspond to usage on the plateform after 2015. The current usage metrics is available 48-96 hours after online publication and is updated daily on week days.
Initial download of the metrics may take a while.