Fig. 2.
Download original image
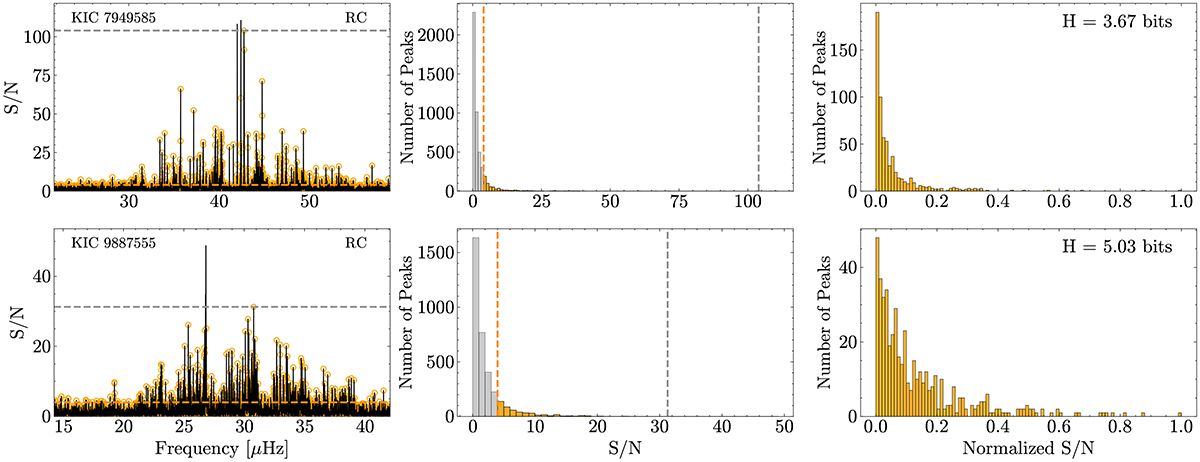
Power density spectra (PDSs) and corresponding histograms of power for two stars with different levels of complexity. The upper panel shows KIC 7949585, which exhibits lower entropy (low complexity), while the lower panel shows KIC 9887555, which has higher entropy (high complexity). The dashed yellow line is the S/N threshold of 4, and the dashed gray line shows the maximum S/N of the selected peaks (see detail about how we select peaks in Sect. 3.2). Peaks that are used in the entropy calculation are marked as yellow circles at the peak maxima position in the left panels, which fall into the yellow bins in the middle panels. In the middle panels, the histograms have a bin width of 1. We normalized their S/Ns to scale the values to the range from 0 to 1 (right panels). The right panels show histograms created by binning the normalized power values into 100 equally spaced bins. These are the probability distributions used in the entropy calculation, Eq. (4).
Current usage metrics show cumulative count of Article Views (full-text article views including HTML views, PDF and ePub downloads, according to the available data) and Abstracts Views on Vision4Press platform.
Data correspond to usage on the plateform after 2015. The current usage metrics is available 48-96 hours after online publication and is updated daily on week days.
Initial download of the metrics may take a while.