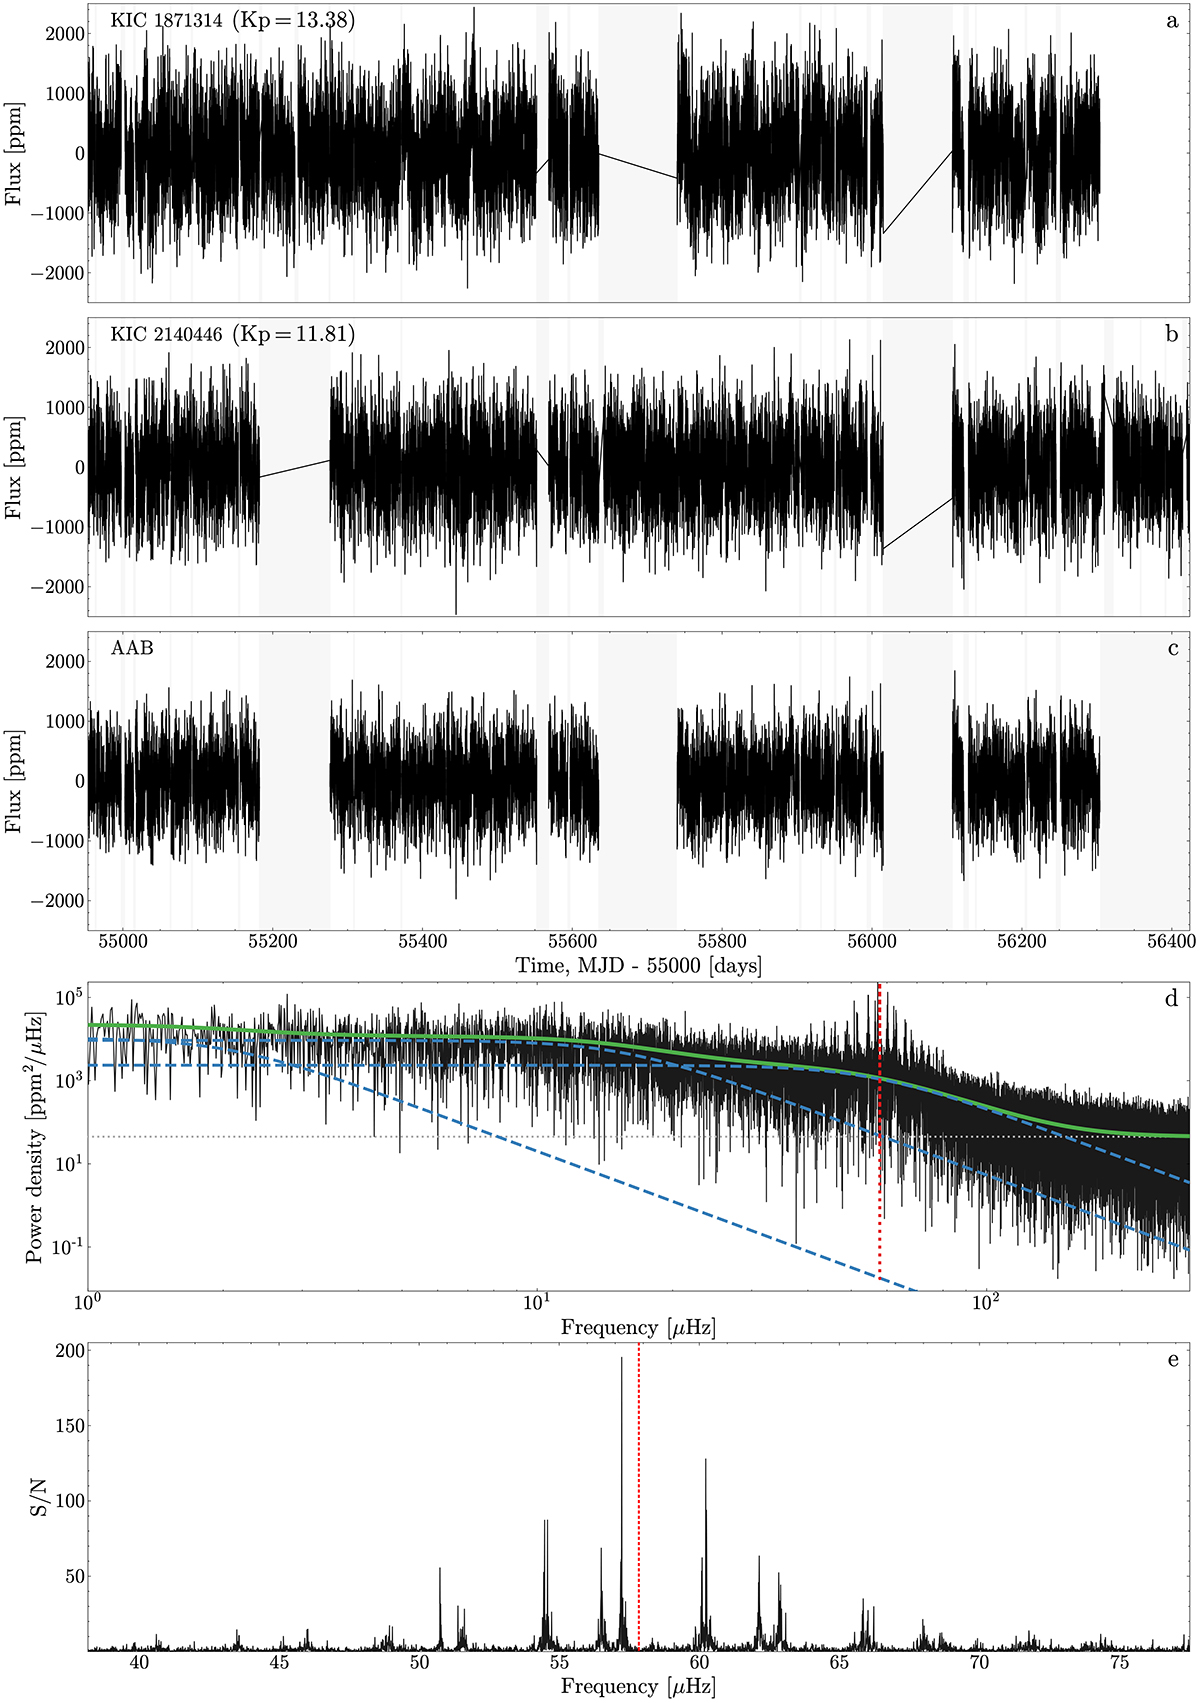
Fig. 1.
Download original image
Process of creating the light curve of an AAB star and its PDSs. Panels a and b: Individual light curves of two red-giant stars (KIC 1871314 and KIC 2140446). Panel c: Combined artificial light curve. The shaded light gray regions indicate areas where data points are not available. Panel d: PDS of the light curve from panel c. In this panel, the dashed blue lines represent granulation background components, the dotted gray line indicates the white noise component, and the green line shows the total background fit. Panel e: Background-corrected PDS in the frequency range of νmax±3σenv. The vertical dashed red line in panels d and e indicates the location of νmax estimated as explained in Sect. 3.1.2.
Current usage metrics show cumulative count of Article Views (full-text article views including HTML views, PDF and ePub downloads, according to the available data) and Abstracts Views on Vision4Press platform.
Data correspond to usage on the plateform after 2015. The current usage metrics is available 48-96 hours after online publication and is updated daily on week days.
Initial download of the metrics may take a while.