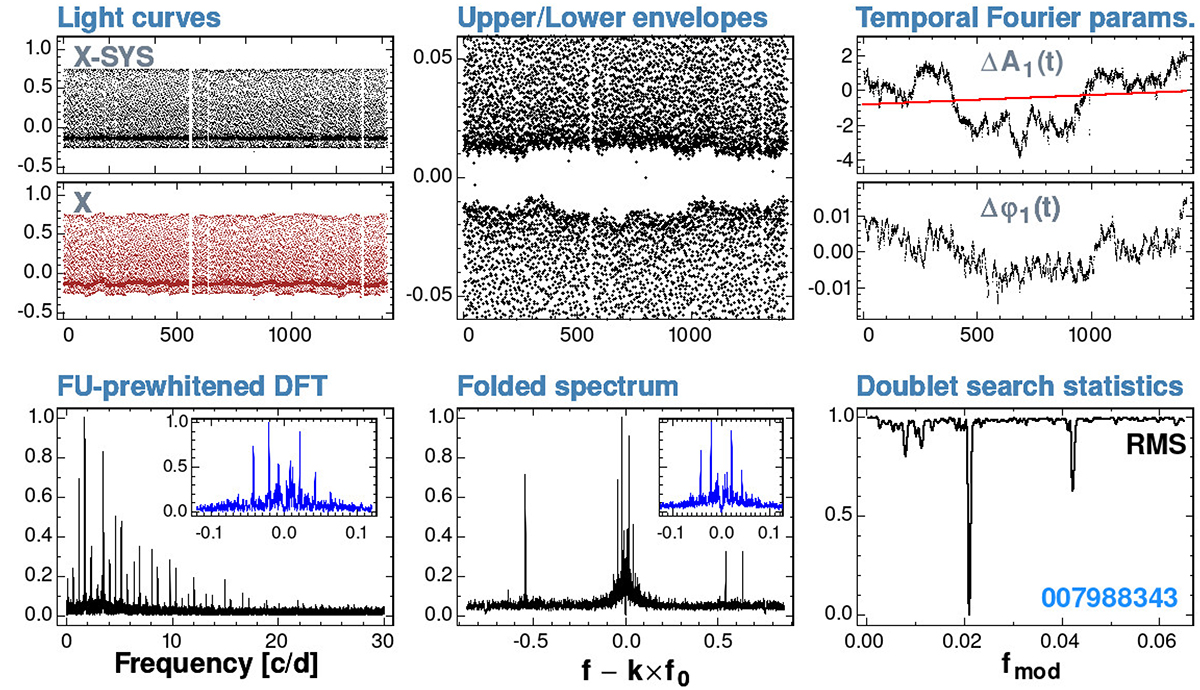
Fig. 2.
Download original image
Example of diagnostic diagrams for an RR Lyrae star from the Kepler field, used in search for modulated stars. Upper row, from left to right: Systematics-corrected (upper subpanel) and raw light curves; units on the horizontal and vertical axes are in days and relative magnitudes, respectively. Close-up of the lower and upper parts (respectively, upper and lower halves of the panel) of the filtered light curve shown in the first panel (units are the same as in the first panel). Variation (relative to the average) of the time-dependent Fourier parameters at the fundamental frequency f0. The red line indicates the linear regression to ΔA1(t). Vertical axis units: [ppt] and [rad]. Lower row, from left to right: Full DFT of the prewhitened data, with the inset zooming on the region of f0 (the horizontal axis shows f − f0). Folded spectrum, with a similar plot structure as in the previous panel. RMS values of the doublet search at various modulation frequencies. The KIC ID (also known as V1510 Cyg) is shown in the lower right corner. All vertical axes are normalized to the peak values; horizontal axes have the same units (i.e., [c/d]). See Sect. 2 for additional details.
Current usage metrics show cumulative count of Article Views (full-text article views including HTML views, PDF and ePub downloads, according to the available data) and Abstracts Views on Vision4Press platform.
Data correspond to usage on the plateform after 2015. The current usage metrics is available 48-96 hours after online publication and is updated daily on week days.
Initial download of the metrics may take a while.