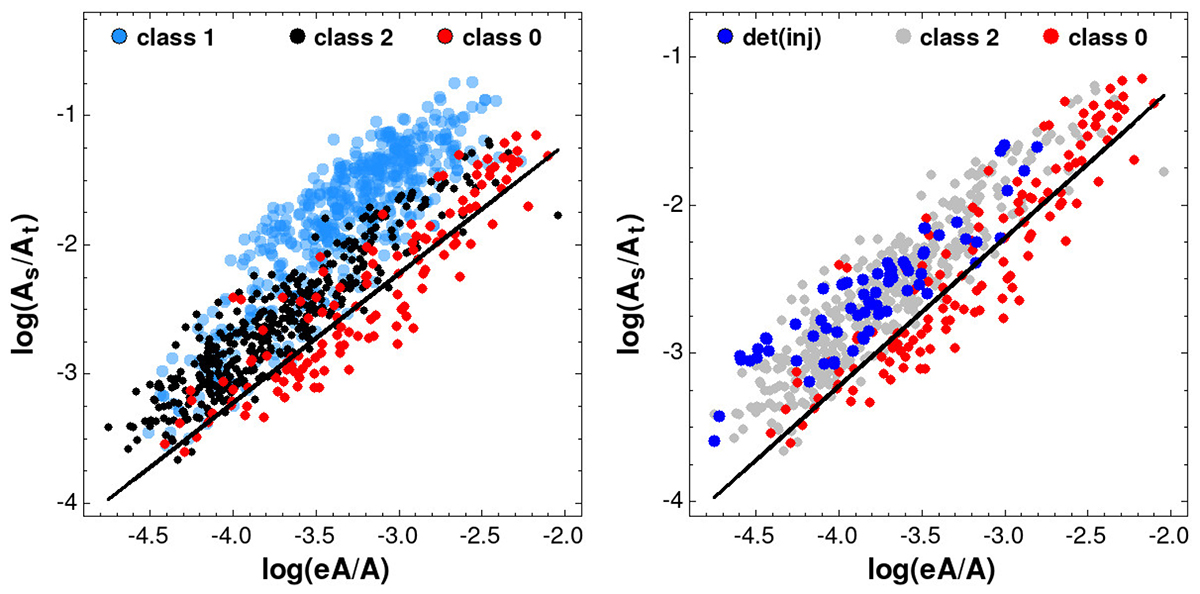
Fig. 10.
Download original image
Left: Relative amplitude error (see Fig. 2) vs. relative side-lobe amplitudes for the 1061 RRab stars from 12 K2 fields. The straight line corresponds to As/At = 6 × eA/A, which we identify as the 6σ detection limit in this paper. Right: Injected signal test for the 17 class 0 and class 2 stars in C08 of K2 (blue points). As in Fig. 9, we plot the results for all data sources used in the signal injection test.
Current usage metrics show cumulative count of Article Views (full-text article views including HTML views, PDF and ePub downloads, according to the available data) and Abstracts Views on Vision4Press platform.
Data correspond to usage on the plateform after 2015. The current usage metrics is available 48-96 hours after online publication and is updated daily on week days.
Initial download of the metrics may take a while.