Open Access
Fig. D.1
Download original image
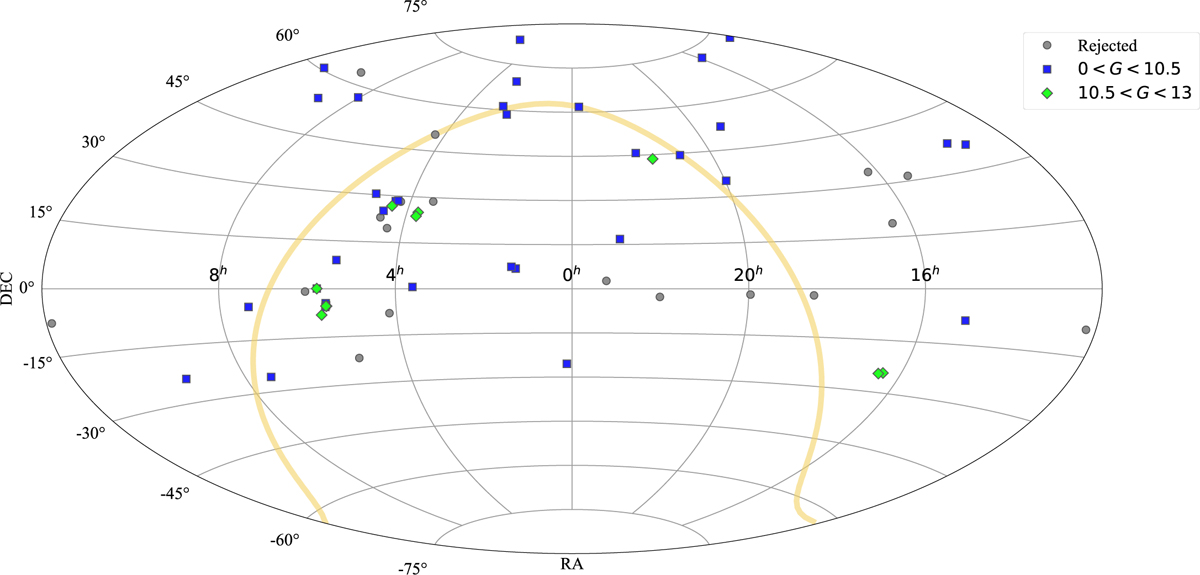
The sky distribution (Aitoff projection in equatorial coordinates) of the radio stars used in this study. The blue squares and green diamonds denote samples used in solution 0 < G < 10.5 and 10.5 < G < 13, respectively. The rejected stars are plotted as grey dots. The Galactic Equator is plotted in yellow.
Current usage metrics show cumulative count of Article Views (full-text article views including HTML views, PDF and ePub downloads, according to the available data) and Abstracts Views on Vision4Press platform.
Data correspond to usage on the plateform after 2015. The current usage metrics is available 48-96 hours after online publication and is updated daily on week days.
Initial download of the metrics may take a while.