| Issue |
A&A
Volume 699, July 2025
|
|
|---|---|---|
| Article Number | A249 | |
| Number of page(s) | 7 | |
| Section | Interstellar and circumstellar matter | |
| DOI | https://doi.org/10.1051/0004-6361/202555063 | |
| Published online | 11 July 2025 | |
Rings and arcs around evolved stars
IV. Characterizing the physical properties of the rings around IC 418 with MUSE
1
Department of Space, Earth and Environment, Chalmers University of Technology, Onsala Space Observatory,
43992
Onsala,
Sweden
2
Instituto de Astrofísica de Andalucía, IAA-CSIC, Glorieta de la Astronomía S/N,
Granada
1800,
Spain
3
Instituto de Astronomía y Meteorología, Departamento de Física, CUCEI, Universidad de Guadalajara,
Av. Vallarta 2602, Arcos Vallarta,
44130
Guadalajara,
Mexico
4
Instituto de Radioastronomía y Astrofísica, Universidad Nacional Autónoma de México,
58089
Morelia, Michoacán,
Mexico
★ Corresponding author: borjamm@chalmers.se
Received:
7
April
2025
Accepted:
2
June
2025
Context. A fraction of planetary nebulae (PNe) presents ring-like features in their halos and outermost envelopes. These are thought to be the relic of the last mass loss gaps at the end of the asymptotic giant branch (AGB) phase, providing information on cyclic mass-loss modulations associated either with stellar pulsations or binary interactions.
Aims. We aim at characterizing the spatial and physical properties of the ring-like features around IC 418, the iconic Spirograph Nebula.
Methods. Deep Very Large Telescope (VLT) Multi Unit Spectroscopic Explorer (MUSE) integral field spectroscopic observations and sharp Hubble Space Telescope (HST) images have been investigated to search for the faintest arc-like features and to characterize their physical properties.
Results. Up to 10 concentric arc-like features are detected, with a notable change in the inter-ring gap, which is smaller for the innermost rings. This is interpreted as evidence of the interaction of the expanding nebula with the arc-like features, which otherwise would expand slower. The nebula proper motion also affects the shape and gap between arc-like features.
Conclusions. The extinction radial profile decreases outward, indicating the presence of dust. Otherwise the electronic temperature (Te) and density (ne) derived both from emission line radial profiles and integrated spectra extracted show values around 10 000 K and 8000 cm−3, respectively. Collectively these results indicate distinct differences between the inner nebula, which is denser and more extincted, and the ring-like structures.
Key words: binaries: general / stars: low-mass / stars: winds, outflows / planetary nebulae: general / planetary nebulae: individual: IC 418
© The Authors 2025
 Open Access article, published by EDP Sciences, under the terms of the Creative Commons Attribution License (https://creativecommons.org/licenses/by/4.0), which permits unrestricted use, distribution, and reproduction in any medium, provided the original work is properly cited.
This article is published in open access under the Subscribe to Open model. Subscribe to A&A to support open access publication.
1 Introduction
Asymptotic giant branch (AGB) stars experience heavy mass loss episodes before becoming planetary nebulae (PNe). The last major gasps of mass loss can be detected as faint detached halos (Chu 1989; Stanghellini 1997) and ring-like structures surrounding the bright nebular shells of PNe and their immediate precursors proto-PNe, before the onset of photoionization. Ring-like features and arcs were first detected and then routinely searched for with the advent of the Hubble Space Telescope (HST; see, e.g., Kwok et al. 1998; Sahai et al. 1998; Terzian & Hajian 2000; Balick et al. 2001). Their detection is also possible using deep images obtained at ground-based optical facilities as well as at IR facilities (Corradi et al. 2004; Phillips et al. 2009, 2010; Phillips & Ramos-Larios 2010; Ramos-Larios et al. 2011). The most comprehensive search so far for ring-like structures around PNe and proto-PNe included publicly available optical and IR observations of a sample of about 650 sources (Ramos-Larios et al. 2016). Only ≃8% of these sources exhibit rings, which can be classified as completed rings, broken rings (or arcs), equatorial arcs, disconnected arcs, and elliptical arcs.
The generally fragmented appearance of these structures in PNe and proto-PNe contrasts with the complete spiral structures detected in the circumstellar envelopes of AGB stars. The first of these spirals was detected in the HST images of AFGL 3068 (Mauron & Huggins 2006), but radio and submillimeter observations have proven to be much more efficient in detecting spirals around AGB stars (see, for example, Maercker et al. 2012; Cernicharo et al. 2015; Kim et al. 2017). It is commonly accepted that spirals in the circumstellar envelope of AGB stars form as a result of binary interactions, since stellar or substellar companions (including massive planets) modulate the geometry of the AGB wind, producing 3D spiral patterns that can be observed either as an Archimedean spiral or as disconnected arcs depending on the viewing angle (e.g., Mastrodemos & Morris 1999; He 2007; Kim et al. 2019; Aydi & Mohamed 2022; Decin et al. 2020; Maes et al. 2021).
A comparison of multi-epoch HST images of three PNe, namely NGC 6543, NGC 7009 and NGC 7027 to images of the AGB star AFGL 3068 suggests that the ring-like structures of PNe could be remnants of previous AGB spiral structures (Guerrero et al. 2021). The subsequent increase in the photoionizing flux and stellar wind from the post-AGB evolution of the central star of planetary nebula (CSPN), in addition to the occurrence of jets, would result in the development of hydrodynamical instabilities that would erase the spiral structures (Lora et al. 2023). If the latter were to be true, the ring-like structures in the PNe halos could be used to study the last gasps in the evolution of their progenitor stars just before entering the post-AGB phase (Ramos-Larios et al. 2022). In addition, their presence might be taken as an indirect detection of a binary or even a multiple system at the heart of these PNe as demonstrated by the exquisite James Webb Space Telescope observations of NGC 3132 (De Marco et al. 2022).
In this paper, we exploit publicly available Very Large Telescope (VLT) Multi Unit Spectroscopic Explorer (MUSE) commissioning observations of IC 418, a PN with well-known ring-like structures (Fig. 1; Ramos-Larios et al. 2012). These data have already been presented by Monreal-Ibero & Walsh (2022) to investigate the physical conditions of the bright main nebula. Here, we use the VLT MUSE to study the physical properties of the ring-like structures around IC 418 for the first time. The paper is organized as follows: In Section 2, we briefly describe the observations. Section 3 presents our analysis. OUr results are discussed in Section 4, and lastly the conclusions are laid out in Section 5.
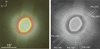 |
Fig. 1 Left: Hybrid VLT MUSE and HST WFPC2 [O III] (blue), Hα (green), and [N II] (red) color-composite optical picture of IC 418. Right: Gray-scale of a hybrid VLT MUSE and HST WFPC2 image including [O III] and Hα VLT MUSE images and [O III], Hα, and [N II] HST WFPC2 images. Apertures for the extracted 1-D spectra are superimposed as white rectangles (see text for details). The aperture along PA 195° was used to extract 1-D spatial profiles. |
2 Observations
2.1 VLT MUSE observations
IC 418 was observed with MUSE on the VLT at the European Southern Observatory at Cerro Paranal on February 4, 2014. These observations were obtained under program 60.A-9100(A) during the commissioning phase of the instrument. MUSE is an integral field spectrograph consisting of an image slicer providing resolved spectra for each of its 0.2″ × 0.2″ spatial element over a field of view ≈1′ × 1′. The MUSE wide field mode, covering a spectral range from 4800–9300 Å with a spectral dispersion of 1.25 Å per channel and a resolving power equal to 1770 at 4800 Å and 3590 at 9300 Å, was used. The average seeing during the observations has a full width at half-maximum (FWHM) of ~1″.
The observations to be analyzed here consist of two 600 s and three 10 s exposures encompassing the main nebular shell of IC 418 and its extended halo. We refer to these as the deep and shallow MUSE observations of IC 418. Data reduction was carried out using EsoReflex within the Kepler workflow engine (Freudling et al. 2013). The MUSE pipeline v2.8.5 was employed. This pipeline performs the basic reduction steps including bias subtraction, flat-fielding, wavelength calibration, and illumination correction. Sky subtraction was performed as the final step in processing the MUSE observations, using the sky background obtained from the outermost spaxels in each science exposure (no dedicated on-sky exposures were gathered). The final data cube consists of 314×306 spaxels, each 0.2″×0.2″ in size.
2.2 Complementary HST WFPC2 images
The HST narrow-band images of IC 418 obtained with the Wide-Field Planetary Camera 2 (WFPC2) reveal clearly the intricate fine structure of its bright nebular shell (Sahai & Trauger 1998), as well as the brightest and smallest rings around it (Ramos-Larios et al. 2012). Thus, in order to trace rings around IC 418 at different spatial scales and surface brightness levels, we retrieved the HST WFPC2 images from the Hubble Legacy Archive1 obtained on February 16, 1999 and September 14, 1999 (Prop. ID 6353 and 7501). Particularly, images obtained in the F502N (λc = 5012 Å, FWHM = 26.9 Å), F656N (λc = 6564 Å, FWHM = 21.5 Å), and F658N (λc = 6591 Å, FWHM = 28.5 Å) narrow band filters were downloaded. The observations consisted of series of six exposures with total exposure times of 360 s for the [O III] filter and 420 s for the [N II] filter, and eight exposures with total exposure time of 888 s for the Hα filter.
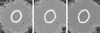 |
Fig. 2 VLT MUSE [O III], Hα and [N II] SDA images of IC 418. The faintest rings are most prominent in the Hα image (middle), whereas the [O III] and [N II] images (left and right respectively) show the best details of the innermost nebula. Each frame is 40″ × 40″ with N at the top and E to the left. |
3 Data analysis
The deep MUSE observations of IC 418 presented in Fig. 1 reveal a number of rings around its main nebular shell at large angular separation in the [O III] and Hα emission lines images, which had not been not detected before. However, the images in these bright nebular emission lines present numerous small- and large-scale artifacts. These include not only a broad scattered-light pattern along position angles (PA) ≈170° and 350° caused by internal reflections within MUSE, but also a series of glitches along the edges of the different sections of the MUSE image slicer seen in the image as vertical mismatches in the surface brightness (Fig. 1-right). Finally, the bright [O III] and Hα emission of the nebular shell saturates the detector, which results in bleeding along the horizontal lines in the image. All these effects have a strong impact on the assessment of the emission from the much fainter rings around IC 418.
To mitigate these effects, we combined narrow band images extracted from the MUSE shallow and deep data cube in the [O III] λ5007 Å, Hα, and [N II] λ6584 Å emission lines together with HST WFPC2 images in these same emission lines. This combination provides the hybrid color-composite high-quality image of IC 418 shown in the left panel of Fig. 1. Here, the HST WFPC2 images are used to enhance the intricate structures and small-scale features of the main nebula and the innermost rings outside it; the deep MUSE data to disclose the weak and outermost rings; and the shallow MUSE data to connect these two datasets, revealing the intermediate rings. This technique, developed by our group (see, e.g., Ramos-Larios et al. 2022; Gómez-González et al. 2020; Guerrero et al. 2021; Sabin et al. 2021; Toalá et al. 2021; Ramos-Larios et al. 2018, and references therein), registers the lower-resolution VLT MUSE image to match the higher-resolution HST WFPC2 image. It should be noted that we also included in our composition the image downloaded from hubblesite.org2.
4 Properties of the ring-like features
4.1 Spatial distribution
The deep VLT MUSE observations reveal a number of ring-like features outside the main nebula, which are most prominent in the Hα and [O III] emission lines. A combination of these deep VLT MUSE images and a sharper HST WFPC2 image further emphasizes these ring-like features, extending them down closer to the main nebula. Up to seven ring-like features can be noticed by eye in Fig. 1. The rings are emphasized in the [O III], Hα, and [N II] images using the SDA (shift-divide-add) technique (see Corradi et al. 2004) in Fig. 2. The ring-like features are mostly round, although the largest and faintest ones show some deviations. It should be noted that the ring-like features appear be closer to the central star toward the NW, consistent with the star’s proper motion along PA ≈ + 35° (μα = +2.078 ± 0.031 mas yr−1, μδ = +1.450 ± 0.025 mas yr−1, Gaia Collaboration 2016, 2021).
Ramos-Larios et al. (2012) analyzed HST WFPC2 images of IC 418 and extracted an [N II] surface-brightness profile of its halo along PA 277°. After removing the underlying halo emission using a polynomial fit, they revealed four peaks corresponding to four ring-like features at radial distances from the CSPN of 7 to 11″. Unfortunately, the VLT MUSE observations along this PA are notably affected by scattered light from the bright main nebula. Instead, Hα and [O III] surface-brightness profiles of the halo of IC 418 were extracted from the VLT MUSE integrated emission maps in these lines along a clean direction at a close PA of 195° (see Fig. 1-right). After similarly removing the underlying halo emission – this time using power-law functions on the nebular radius – both the Hα and [O III] spatial profiles shown in Fig. 3 recover the peak of the ring-like feature at a radius of ≈11″ in the HST [N II] profile and find six additional ring-like features at radial distances up to ~24″. The total number of ring-like features amounts to ten, with an average separation of 1.1″ between the innermost rings in the HST profile and 2.2″ between the outermost rings in the VLT MUSE profiles3. At a distance of 1.36 kpc, this implies inter-ring gaps of 0.007 and 0.014 pc, respectively. Adopting the typical expansion velocity of 15 km s−1 for these structures in PNe and AGB stars (Guerrero et al. 2020, and references therein), the time-lapse between rings would be 475–950 yr. This increases to 700–1400 yr if the AGB stellar wind velocity were 10 km s−1, as is usually adopted (see Ramstedt et al. 2020). At any rate, these timescales are much shorter than the ≈105 yr timescale of thermal pulses in AGB stars (e.g., Vassiliadis & Wood 1993).
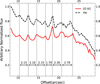 |
Fig. 3 [O III] (solid red line) and Hα (dashed black line) emission lines profiles along a PA of 195° (see Fig. 1). A power law with exponent r3.9 was subtracted to enhance the emission of the ring-like features. |
4.2 Physical properties
The radial variation in the logarithmic extinction coefficient c(Hβ), electronic density ne, and temperature Te across the ring-like features is presented in Fig. 4. These were obtained from MUSE data using radial profiles of the Hα to Hβ line ratio, the density-sensitive [S II] λλ6716,6731 doublet ratio, and the temperature-sensitive [N II] λ5755 to [N II] λλ6548,6584 line ratio, respectively. The line intensity radial profiles were obtained by integrating the emission over annular apertures 0.2″ in width, excluding regions of unreliable flux, as previously described. Profiles were also obtained from the integrated emission along multiple directions, at the same PA as the apertures shown in Fig. 1, using pseudo-slits 2.5″ in width.
In both cases, the continuum emission was carefully subtracted. Uncertainty in the emission line profiles was calculated using the formula proposed by Tresse et al. (1999), and error propagation was subsequently carried out through Monte Carlo simulations with 1000 iterations to obtain the uncertainty in the profiles of the physical parameters. As the properties derived from both methods were consistent, we adopted the first method because it provides less noisy profiles.
4.2.1 Extinction radial profile
The radial variation of the logarithmic extinction coefficient c(Hβ) (top panel of Fig. 4) was derived using the Hα to Hβ line ratio, adopting a recombination case B (Osterbrock & Ferland 2006). The Hα to Hβ line ratio is considered to be reliable in the radial range from 11 up to 26″. Below 11″, the Hα emission is affected by scattered emission from the bright inner shell, producing a spurious reduction in the extinction coefficient. Above 26″, the Hβ flux emission is dominated by noise.
The extinction is essentially flat around 0.20 in the range from 11″ to 15″, then decreases steadily down to 0.10 at a radial distance of 21″ and remains constant outward. For comparison the extinction in the main nebula has an averaged value of 0.26 ± 0.06 (Monreal-Ibero & Walsh 2022).
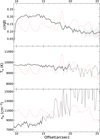 |
Fig. 4 Radial profiles of the logarithmic extinction coefficient c(Hβ) (top), electron temperature Te (middle), and electronic density ne (bottom) in the halo of IC 418 (black lines) overlaid by the radial profile of the [O III] λ5007 emission line presented in Fig. 3 (dashed red line). The radial range where the estimates of these physical parameters are found to be reliable is shown with a solid black line and its respective error bars, whereas regions where they become notably uncertain are indicated by thin, dashed black lines. |
4.2.2 Electron temperature and density radial profiles
To derive values of the electron temperature, Te, and density, ne, for the ring-like features of IC 418, the previously derived extinction profile was adopted We used PyNeb (Luridiana et al. 2015) to obtain the radial profiles of Te and ne shown in the middle and bottom panels of Fig. 4, respectively, from the corresponding radial profiles of the density-sensitive [S II] λλ6716,6731 doublet ratio and the temperature-sensitive [N II] λ5755 to λλ6548,6584 line ratio. We note that PyNeb simultaneously computes Te and ne, including the cross-dependence of both parameters.
Within the radial range, where the electron temperature Te and density ne can be reliably determined (solid black lines in the corresponding panels of Fig. 4), they have average values of 9700 K and 8000 cm−3, respectively. The temperature appears to exhibit an outward-decreasing gradient, while the density appears to show the opposite behavior, an outward-increasing gradient. We note, however, that the amplitude of these trends lies within the uncertainty of the temperature and density determinations; thus these gradients should not be fully trusted. The values of electron temperature and density computed for the outermost regions of the main nebula in the vicinity of the halo by Monreal-Ibero & Walsh (2022) are 10 100 K and 5000 cm−3, respectively. The values calculated here simultaneously for the halo are generally consistent with these, although the average density obtained is higher (see discussion for more details).
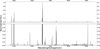 |
Fig. 5 Averaged spectrum from the apertures shown in Fig. 1. The bottom panel is intensity-zoomed to show the weaker emission lines. |
4.2.3 Average spectrum
One-dimensional spectra were extracted from the apertures shown in Fig. 1 (right panel) toward the NW, SE, and SW directions, avoiding the innermost saturated regions of the halo of IC 418. After confirming that there were no significant differences among them, the spectra were averaged into a single, higher signal-to-noise ratio spectrum, which is presented in Fig. 5. An average extinction of c(Hβ) = 0.17±0.03 was obtained, which is consistent with the radial variation of c(Hβ) shown in the top panel of Fig. 3.
The de-reddened line intensity ratios normalized to a value of 100 for Hβ are presented in Table 1. The 1-σ uncertainty in the line intensities was calculated using the formula proposed by Tresse et al. (1999). The spectrum exhibits a wealth of faint emission lines whose identification is hampered by the current spectral resolution. The identifications in Table 1 were facilitated by the line list for the main nebula of IC 418 provided by Sharpee et al. (2003). Lines with fluxes is below 1% of the Hβ line flux and corresponding to unusual species are marked with an asterisk (*) next to the ion. The emission line at 5959 Å is marked with a question mark (?) as its association with Si I λλ5696.3,5696.7 Å is considered the most likely among other possible lines.
Perhaps one of the most singular properties of the spectrum of the ring-like features of IC 418 is the faintness of the [O III] emission lines, with the brightest line at 5007 Å only ≃50% times brighter than Hβ. On the other hand low-excitation emission lines such as those of [O II], [S II], and especially [N II] at 6584 Å are relatively bright, with the latter being ≈60% that of Hα. It should also be noted that the detection of transitions of [O I] and [N I] from neutral species of O and N, respectively, were detected.
4.2.4 Average physical properties and chemical abundances
We used the emission lines listed in Table 1 to derive average values of Te and ne to then assess the possible ionization state of the outer rings in IC 418. The software PyNeb with its default atomic database was used to compute Te using the auroral [N II] λ5755 to nebular [N II] λλ6548,6584 emission line ratios, and ne using the [S II] λλ6717,6731 and [Cl III] λλ5517,5537 line doublet ratios. These result in values of 9700 K and 8300 and 10 700 cm−3, respectively, which are consistent with their average values obtained from the radial profiles shown in Fig. 3, but differ from those reported by Monreal-Ibero & Walsh (2022).
The software PyNeb was then used to compute the ionic abundances presented in Table 2. Nevertheless, the absence of a reliable He II emission line4 prevented us from obtaining total abundances.
5 Discussion and conclusion
The detection of ring-like features in PNe is typically hampered by the low surface brightness of these structures compared to the much brighter central nebular region (see, e.g., Corradi et al. 2004; Ramos-Larios et al. 2011), as well as by, the need for high spatial resolution observations to avoid dilution of their emission. These challenges are evident in the case of IC 418, where the number of arcs previously identified from the HST images (Ramos-Larios et al. 2012) have been increased from four to ten with the new deep MUSE observations. These findings support the possible existence of faint ring and/or arc-like features still to be detected in PNe or proto-PNe (see also the case of IC 4406, Ramos-Larios et al. 2022). Therefore it is possible that future deep observations may reveal previously undetected structures, potentially increasing the detection rate from the ≃8% estimated by Ramos-Larios et al. (2016) from a sample of 655 objects, and thus helping to reconcile the discrepancy with the occurrence rate of ring and/or arc-like features around PNe and proto-PNe of ≃35% proposed by Corradi et al. (2004).
The inter-ring gap in IC 418 seems to increase with distance from the star, in accordance with previous results (Corradi et al. 2004). The closer rings would be compressed either by the expansion of the inner shell into the halo or by a decreased time-lapse between rings. The abrupt difference among the inter-ring gaps of inner (1.1") and outer rings (2.2"), rather than a gradual increase, points toward the first scenario. However, it should be noted that the inter-ring gaps of the outer rings vary significantly, ranging from 1.7″ to 2.7″. If we assume that the 0.015 pc gap between the outermost ring-like features corresponds to the unperturbed modulation of mass loss by a companion, this would suggest a binary period of ≃1000–1400 yr, given an expansion velocity of the rings in the range 10–15 km s−1.
Inner and outer rings also show morphological differences, with the inner rings having an elliptical morphology (Ea type according to the classification defined by Ramos-Larios et al. 2016) and the outermost ones being rounder (R-rings type). The elongation of the inner rings along the same direction as the major axis of the inner layer also supports their interaction with the expanding main nebula. In such case, IC 418 represents an intermediate stage between Vy 1–2, an archetype of R rings (Sahai et al. 2011), and IC 4406, whose rings broke due to the expansion of the innermost shells (Ramos-Larios et al. 2022).
The determination of the physical properties in the ring-like features is even more challenging, given the high quality of the spectra required to detect the density and temperature-sensitive emission lines in the spectra of rings at an adequate S/N. The VLT’s large aperture, along with the long-exposure and large spatial coverage of the MUSE data used here, uniquely allows the detection of these lines to derive spatially resolved physical properties of the outermost rings ensemble, including extinction, electron temperature and density.
The extinction in the region of the halo shows a notable radial decline, with a flat value of c(Hβ) ≃ 0.20 for the innermost rings between 11 and 15 arcsec, and a steady decline to a value of ≃0.10 at a radial distance of 21″. An average extinction c(Hβ) of 0.17 can be estimated for the region of the halo of IC 418 that exhibits ring-like features, which is notably smaller than the extinction of 0.26 ± 0.06 estimated for the inner shell (Monreal-Ibero & Walsh 2022). Values in the literature for c(Hβ) range from 0.14 to 0.37 (see, e.g., Sterling et al. 2015; Dopita et al. 2017; Pignata et al. 2023). The radial variation of c(Hβ) from the inner shell and throughout the halo is consistent with a gradual decline in extinction at larger radial distances. This seems to imply that the ring-like features in the halo of IC 418 have a significant dust content (see Ramos-Larios et al. 2012, for a detailed model of the dust emission of IC 418), such that, as the line of sight moves to the innermost regions of IC 418, the dust column density and the extinction increase. Indeed, the dust profile increases along the direction of IC 418 in the latest 3D dust extinction maps based on Gaia eDR3 and 2MASS data (Lallement et al. 2022), indicating that the foreground extinction is AV < 0.33 mag. This implies a logarithmic extinction coefficient of <0.15, consistent with the lowest value of the profile in the top panel of Fig. 4. Thus, the origin of the extinction in IC 418 cannot be blamed purely on interstellar extinction (see, for instance, Monreal-Ibero & Walsh 2022). The detection of arcs, ring-like, or spiral features in scattered light in other PNe and proto-PNe (e.g., AFGL 3068) also supports the presence of significant amounts of dust in these structures.
There is also a notable decline in density from the inner nebula, where values of ne reach up to 14 000 cm−3 (Monreal-Ibero & Walsh 2022), to an average value of ≈8000 cm−3 in the halo (specifically, in the region from 10″ to 15″ from the central stars, where the density determination is most reliable). It is necessary to emphasize that a careful subtraction of the nebular continuum and sky background is completely mandatory to determine the density in the halo given the low surface brightness of the density-sensitive [S II] λλ6716,6731 doublet. The similar density value of 8300 cm−3 derived from the averaged spectrum in Sect. 4.2.3, where Gaussian profiles were fit to the line doublet, which naturally removing those contributions – further supports the determination of the radial density profile.
As for the electron temperature derived from the [N II] emission lines, the value for the rings in the halo region, ≃9700 K, is similar to that of the inner nebula, ≃10 100 K (Monreal-Ibero & Walsh 2022). As noted by these authors, this result is “somewhat unexpected,” although the different density values among these regions may hold the key to understand it. If Monreal-Ibero & Walsh (2022) had used a density value of 15 000 cm−3 for the inner shell, instead of the assumed value of 10 000 cm−3, their estimate of the electron temperature in the inner shell would likely be lower. In such a case, the typical increase in temperature in the halo, expected from radiation hardening, would be observed.
The values of Te and ne and the de-reddened emission line intensities listed in Table 1 were used to compute the ionic abundances presented in Table 2. Ionic abundances of O+/Oo, O++/Oo, O++/O+, and N+/O+ ratios of 6.9, 5.6, 0.9, and 0.6, respectively, were derived. Available estimates of ionic abundances for the inner nebula suggest a slightly higher ionization state for the rings, with a higher O++/O+ ratio. Otherwise, if it is assumed that N+/O+ can be equated to the N/O abundances ratio, as is typically done by ionization correction factors (Kingsburgh & Barlow 1994), the N/O ratio in the rings is slightly above the range of 0.17 to 0.56 derived for the inner nebula (see Hyung et al. 1994; Henry et al. 2000; Pottasch et al. 2004, and references therein). It is worth noting the strong dependence of the N+/O+ ionic abundances ratio derived from [N II] and [O II] emission lines, on Te.
Calculations on the properties of ring-like structures in halos were carried out only for NGC 6543 (also know as the Cat’s Eye Nebula Balick et al. 2001) and IC 4406 (Ramos-Larios et al. 2022). While the former authors found similar properties between the main nebula and the ring-like features, the latter reported differences in both Te and ne values as well as in the ionization state. As for IC 418, ne is lower in the ring-like structures of its halo than in the main nebula, which shows densities up to 14 000 cm−3 (Monreal-Ibero & Walsh 2022). In summary, the physical properties and ionization appear to be reasonably different from those of the inner nebula, similar to the case of IC 4406 (Ramos-Larios et al. 2022). The origin of these differences most likely arises from the increased mass loss rate that produced the PN as well as the differences in the radiation field reaching these regions.
IC 418 ring-like features with de-reddened emission line intensities.
Ionic abundances and ratios for the outer ring-like features of IC 418.
Acknowledgements
B.M.M. and M.A.G. acknowledge financial support from grants CEX2021-001131-S funded by MCIN/AEI/10.13039/501100011033 and PID2022-142925NB-I00 from the Spanish Ministerio de Ciencia, Innovación y Universidades (MCIU) cofunded with FEDER funds. GR-L acknowledges support from Secretaría de Ciencia, Humanidades, Tecnología e Innovación (SECIHTI). JAT thanks UNAM PAPIIT project IN102324. We appreciate Dr. Jorge García-Rojas help in the identification of faint emission lines in the spectrum of the rings of IC 418.
References
- Aydi, E., & Mohamed, S. 2022, MNRAS, 513, 4405 [NASA ADS] [CrossRef] [Google Scholar]
- Balick, B., Wilson, J., & Hajian, A. R. 2001, AJ, 121, 354 [Google Scholar]
- Cernicharo, J., Marcelino, N., Agúndez, M., & Guélin, M. 2015, A&A, 575, A91 [NASA ADS] [CrossRef] [EDP Sciences] [Google Scholar]
- Chu, Y. H. 1989, in Planetary Nebulae, ed. S. Torres-Peimbert, IAU Symposium, 131, 105 [Google Scholar]
- Corradi, R. L. M., Sánchez-Blázquez, P., Mellema, G., Gianmanco, C., & Schwarz, H. E. 2004, A&A, 417, 637 [Google Scholar]
- De Marco, O., Akashi, M., Akras, S., et al. 2022, Nat. Astron., 6, 1421 [Google Scholar]
- Decin, L., Montargès, M., Richards, A. M. S., et al. 2020, Science, 369, 1497 [Google Scholar]
- Dopita, M. A., Ali, A., Sutherland, R. S., Nicholls, D. C., & Amer, M. A. 2017, MNRAS, 470, 839 [Google Scholar]
- Freudling, W., Romaniello, M., Bramich, D. M., et al. 2013, A&A, 559, A96 [NASA ADS] [CrossRef] [EDP Sciences] [Google Scholar]
- Gaia Collaboration (Prusti, T., et al.) 2016, A&A, 595, A1 [NASA ADS] [CrossRef] [EDP Sciences] [Google Scholar]
- Gaia Collaboration (Brown, A. G. A., et al.) 2021, A&A, 649, A1 [NASA ADS] [CrossRef] [EDP Sciences] [Google Scholar]
- Gómez-González, V. M. A., Toalá, J. A., Guerrero, M. A., et al. 2020, MNRAS, 496, 959 [CrossRef] [Google Scholar]
- Guerrero, M. A., Ramos-Larios, G., Toalá, J. A., Balick, B., & Sabin, L. 2020, MNRAS, 495, 2234 [NASA ADS] [Google Scholar]
- Guerrero, M. A., Cazzoli, S., Rechy-García, J. S., et al. 2021, ApJ, 909, 44 [NASA ADS] [CrossRef] [Google Scholar]
- He, J. H. 2007, A&A, 467, 1081 [Google Scholar]
- Henry, R. B. C., Kwitter, K. B., & Bates, J. A. 2000, ApJ, 531, 928 [Google Scholar]
- Hyung, S., Aller, L. H., & Feibelman, W. A. 1994, PASP, 106, 745 [Google Scholar]
- Kim, H., Liu, S.-Y., & Taam, R. E. 2019, ApJS, 243, 35 [Google Scholar]
- Kim, H., Trejo, A., Liu, S.-Y., et al. 2017, Nat. Astron., 1, 0060 [Google Scholar]
- Kingsburgh, R. L., & Barlow, M. J. 1994, MNRAS, 271, 257 [NASA ADS] [CrossRef] [Google Scholar]
- Kwok, S., Su, K. Y. L., & Hrivnak, B. J. 1998, ApJ, 501, L117 [Google Scholar]
- Lallement, R., Vergely, J. L., Babusiaux, C., & Cox, N. L. J. 2022, A&A, 661, A147 [NASA ADS] [CrossRef] [EDP Sciences] [Google Scholar]
- Lora, V., Toalá, J. A., González-Carbajal, J. I., et al. 2023, MNRAS, 522, 3337 [Google Scholar]
- Luridiana, V., Morisset, C., & Shaw, R. A. 2015, A&A, 573, A42 [NASA ADS] [CrossRef] [EDP Sciences] [Google Scholar]
- Maercker, M., Mohamed, S., Vlemmings, W. H. T., et al. 2012, Nature, 490, 232 [NASA ADS] [CrossRef] [Google Scholar]
- Maes, S., Homan, W., Malfait, J., et al. 2021, A&A, 653, A25 [NASA ADS] [CrossRef] [EDP Sciences] [Google Scholar]
- Mastrodemos, N., & Morris, M. 1999, ApJ, 523, 357 [Google Scholar]
- Mauron, N., & Huggins, P. J. 2006, A&A, 452, 257 [NASA ADS] [CrossRef] [EDP Sciences] [Google Scholar]
- Monreal-Ibero, A., & Walsh, J. R. 2022, Galaxies, 10, 18 [NASA ADS] [CrossRef] [Google Scholar]
- Osterbrock, D. E., & Ferland, G. J. 2006, Astrophysics of gaseous nebulae and active galactic nuclei (Sausalito, CA: University Science Books) [Google Scholar]
- Phillips, J. P., & Ramos-Larios, G. 2010, MNRAS, 405, 2179 [NASA ADS] [Google Scholar]
- Phillips, J. P., Ramos-Larios, G., Schröder, K. P., & Contreras, J. L. V. 2009, MNRAS, 399, 1126 [Google Scholar]
- Phillips, J. P., Cuesta, L. C., & Ramos-Larios, G. 2010, MNRAS, 409, 881 [Google Scholar]
- Pignata, R. A., Mast, D., & Weidmann, W. 2023, Bol. Asoc. Argentina Astron. Plata Argentina, 64, 133 [Google Scholar]
- Pottasch, S. R., Bernard-Salas, J., Beintema, D. A., & Feibelman, W. A. 2004, A&A, 423, 593 [Google Scholar]
- Ramos-Larios, G., Phillips, J. P., & Cuesta, L. C. 2011, MNRAS, 411, 1245 [Google Scholar]
- Ramos-Larios, G., Vázquez, R., Guerrero, M. A., et al. 2012, MNRAS, 423, 3753 [Google Scholar]
- Ramos-Larios, G., Santamaría, E., Guerrero, M. A., et al. 2016, MNRAS, 462, 610 [Google Scholar]
- Ramos-Larios, G., Guerrero, M. A., Nigoche-Netro, A., et al. 2018, MNRAS, 475, 932 [Google Scholar]
- Ramos-Larios, G., Toalá, J. A., Rodríguez-González, J. B., Guerrero, M. A., & Gómez-González, V. M. A. 2022, MNRAS, 513, 2862 [Google Scholar]
- Ramstedt, S., Vlemmings, W. H. T., Doan, L., et al. 2020, A&A, 640, A133 [EDP Sciences] [Google Scholar]
- Sabin, L., Guerrero, M. A., Zavala, S., et al. 2021, MNRAS, 501, 3582 [NASA ADS] [Google Scholar]
- Sahai, R., & Trauger, J. T. 1998, AJ, 116, 1357 [NASA ADS] [CrossRef] [Google Scholar]
- Sahai, R., Trauger, J. T., Watson, A. M., et al. 1998, ApJ, 493, 301 [Google Scholar]
- Sahai, R., Morris, M. R., & Villar, G. G. 2011, AJ, 141, 134 [NASA ADS] [CrossRef] [Google Scholar]
- Sharpee, B., Williams, R., Baldwin, J. A., & van Hoof, P. A. M. 2003, ApJS, 149, 157 [Google Scholar]
- Stanghellini, L. 1997, in Planetary Nebulae, 180, eds. H. J. Habing, & H. J. G. L. M. Lamers, 319 [Google Scholar]
- Sterling, N. C., Porter, R. L., & Dinerstein, H. L. 2015, ApJS, 218, 25 [Google Scholar]
- Terzian, Y., & Hajian, A. R. 2000, in Asymmetrical Planetary Nebulae II: From Origins to Microstructures, eds. J. H. Kastner, N. Soker, & S. Rappaport, Astronomical Society of the Pacific Conference Series, 199, 33 [Google Scholar]
- Toalá, J. A., Rubio, G., Santamaría, E., et al. 2021, MNRAS, 502, 4658 [Google Scholar]
- Tresse, L., Maddox, S., Loveday, J., & Singleton, C. 1999, MNRAS, 310, 262 [Google Scholar]
- Vassiliadis, E., & Wood, P. R. 1993, ApJ, 413, 641 [Google Scholar]
All Tables
All Figures
|
Fig. 1 Left: Hybrid VLT MUSE and HST WFPC2 [O III] (blue), Hα (green), and [N II] (red) color-composite optical picture of IC 418. Right: Gray-scale of a hybrid VLT MUSE and HST WFPC2 image including [O III] and Hα VLT MUSE images and [O III], Hα, and [N II] HST WFPC2 images. Apertures for the extracted 1-D spectra are superimposed as white rectangles (see text for details). The aperture along PA 195° was used to extract 1-D spatial profiles. |
| In the text | |
|
Fig. 2 VLT MUSE [O III], Hα and [N II] SDA images of IC 418. The faintest rings are most prominent in the Hα image (middle), whereas the [O III] and [N II] images (left and right respectively) show the best details of the innermost nebula. Each frame is 40″ × 40″ with N at the top and E to the left. |
| In the text | |
|
Fig. 3 [O III] (solid red line) and Hα (dashed black line) emission lines profiles along a PA of 195° (see Fig. 1). A power law with exponent r3.9 was subtracted to enhance the emission of the ring-like features. |
| In the text | |
|
Fig. 4 Radial profiles of the logarithmic extinction coefficient c(Hβ) (top), electron temperature Te (middle), and electronic density ne (bottom) in the halo of IC 418 (black lines) overlaid by the radial profile of the [O III] λ5007 emission line presented in Fig. 3 (dashed red line). The radial range where the estimates of these physical parameters are found to be reliable is shown with a solid black line and its respective error bars, whereas regions where they become notably uncertain are indicated by thin, dashed black lines. |
| In the text | |
|
Fig. 5 Averaged spectrum from the apertures shown in Fig. 1. The bottom panel is intensity-zoomed to show the weaker emission lines. |
| In the text | |
Current usage metrics show cumulative count of Article Views (full-text article views including HTML views, PDF and ePub downloads, according to the available data) and Abstracts Views on Vision4Press platform.
Data correspond to usage on the plateform after 2015. The current usage metrics is available 48-96 hours after online publication and is updated daily on week days.
Initial download of the metrics may take a while.