Fig. 2
Download original image
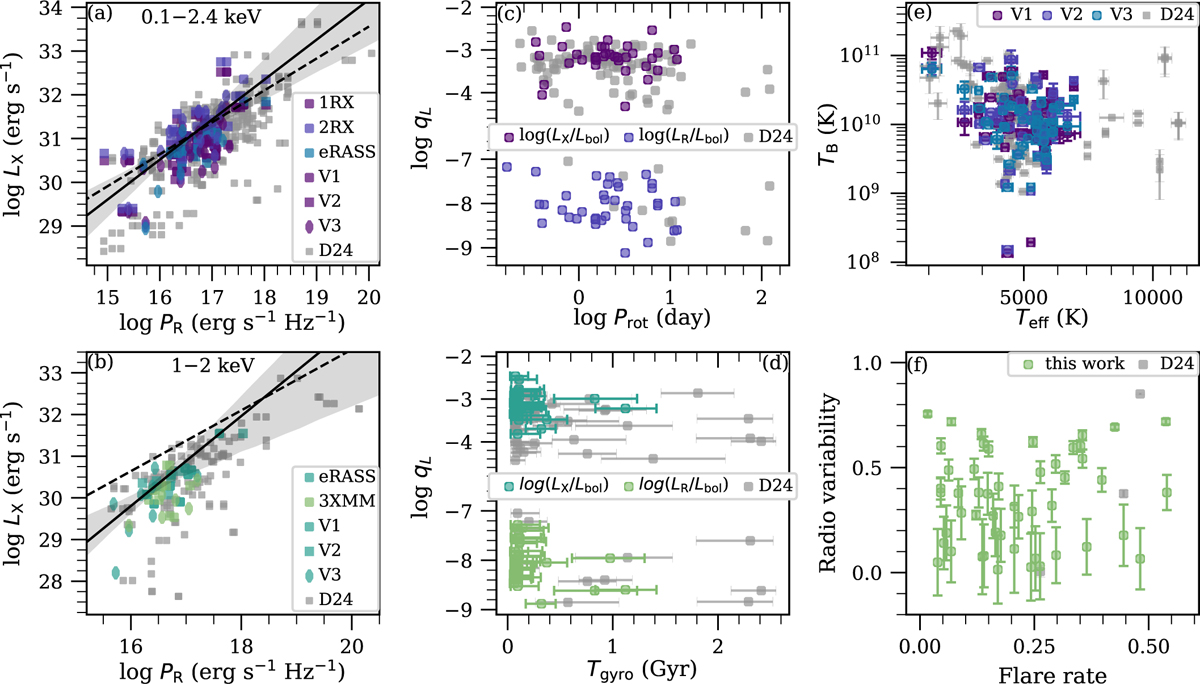
(a, b) Relation of the radio powers and X-ray luminosities final sample of flaring stars. Colour coding denotes the different X-ray survey data, while the three VLASS observational epochs are denoted with circle, square, and diamond markers. The solid black lines and shaded grey regions denote the best-fit model and the 95% confidence interval (see Sect. 3.2), while the dashed lines denote the model by Williams et al. (2014) (a) The first and second ROSAT survey data, and the eROSITA are denoted with violet, blue, and teal, respectively. (b) The eROSITA and XMM-Newton observations are denoted with dark and light green, respectively. (c) Relation of the period and the ratio of the radio/X-ray luminosities to the bolometric luminosity. (d) Relation of the estimated gyrochronological ages and the ratio of the radio/X-ray luminosities to the bolometric luminosity. (e) Relation between the effective and brightness temperatures. (f) Radio variability as the function of the flare rate. The comparison sample from Driessen et al. (2024) is shown with grey circles in each panel.
Current usage metrics show cumulative count of Article Views (full-text article views including HTML views, PDF and ePub downloads, according to the available data) and Abstracts Views on Vision4Press platform.
Data correspond to usage on the plateform after 2015. The current usage metrics is available 48-96 hours after online publication and is updated daily on week days.
Initial download of the metrics may take a while.