Fig. 2
Download original image
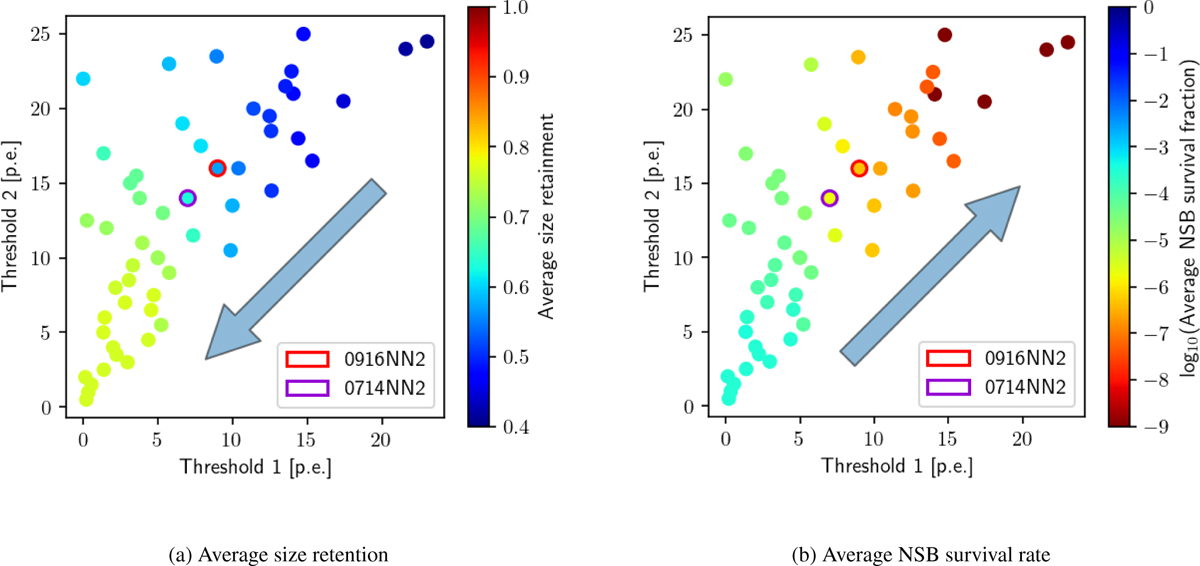
Left: average size retention, determined from pixels containing the shower signals. Right: average NSB survival rate calculated from pixels not containing the shower signal. Both panels show different tail-cut threshold combinations. Red and purple circles indicate the two default configurations. All combinations shown use the same pre-cleaning (3σnoise) as in the default configurations. Arrows indicate the direction of expected performance gain.
Current usage metrics show cumulative count of Article Views (full-text article views including HTML views, PDF and ePub downloads, according to the available data) and Abstracts Views on Vision4Press platform.
Data correspond to usage on the plateform after 2015. The current usage metrics is available 48-96 hours after online publication and is updated daily on week days.
Initial download of the metrics may take a while.