Fig. 10
Download original image
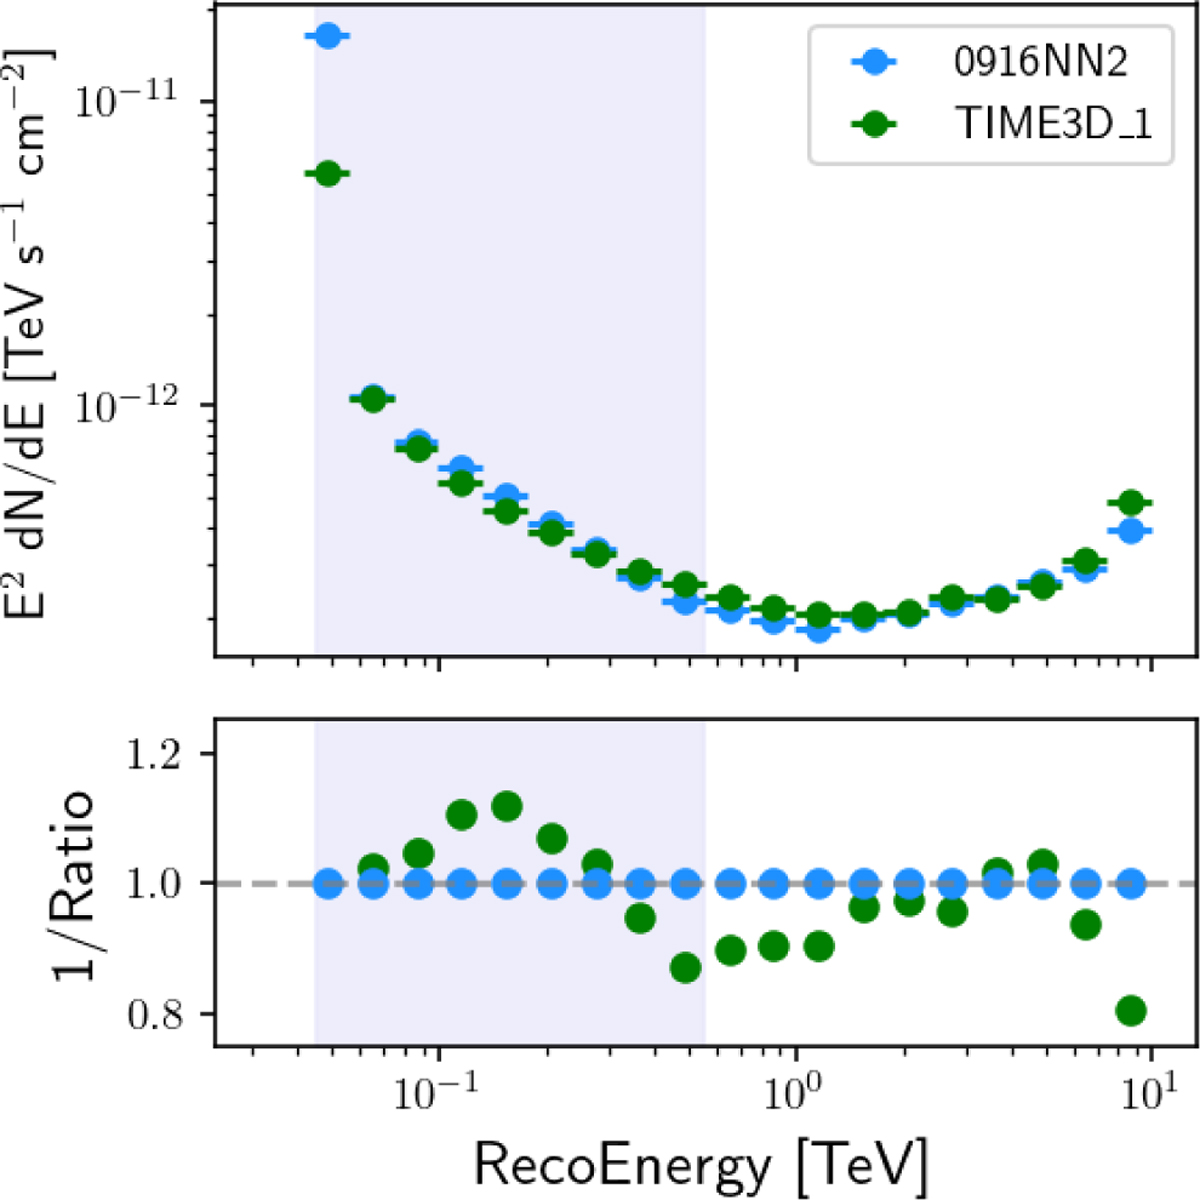
Differential sensitivity comparison between the current default tail-cut cleaning candidate and the best candidate for the performance criterion, TIME3D_1. The upper panel shows the curves, while the lower panel displays the inverse ratio (i.e., values larger than 1 denote a smaller, and thus improved, sensitivity). The first flux point for TIME3D_1 at E = 48.6 TeV corresponds to an improvement of 200% and is omitted from the lower panel for clarity. The blue shaded region indicates the energy range of interest for the performance criterion.
Current usage metrics show cumulative count of Article Views (full-text article views including HTML views, PDF and ePub downloads, according to the available data) and Abstracts Views on Vision4Press platform.
Data correspond to usage on the plateform after 2015. The current usage metrics is available 48-96 hours after online publication and is updated daily on week days.
Initial download of the metrics may take a while.