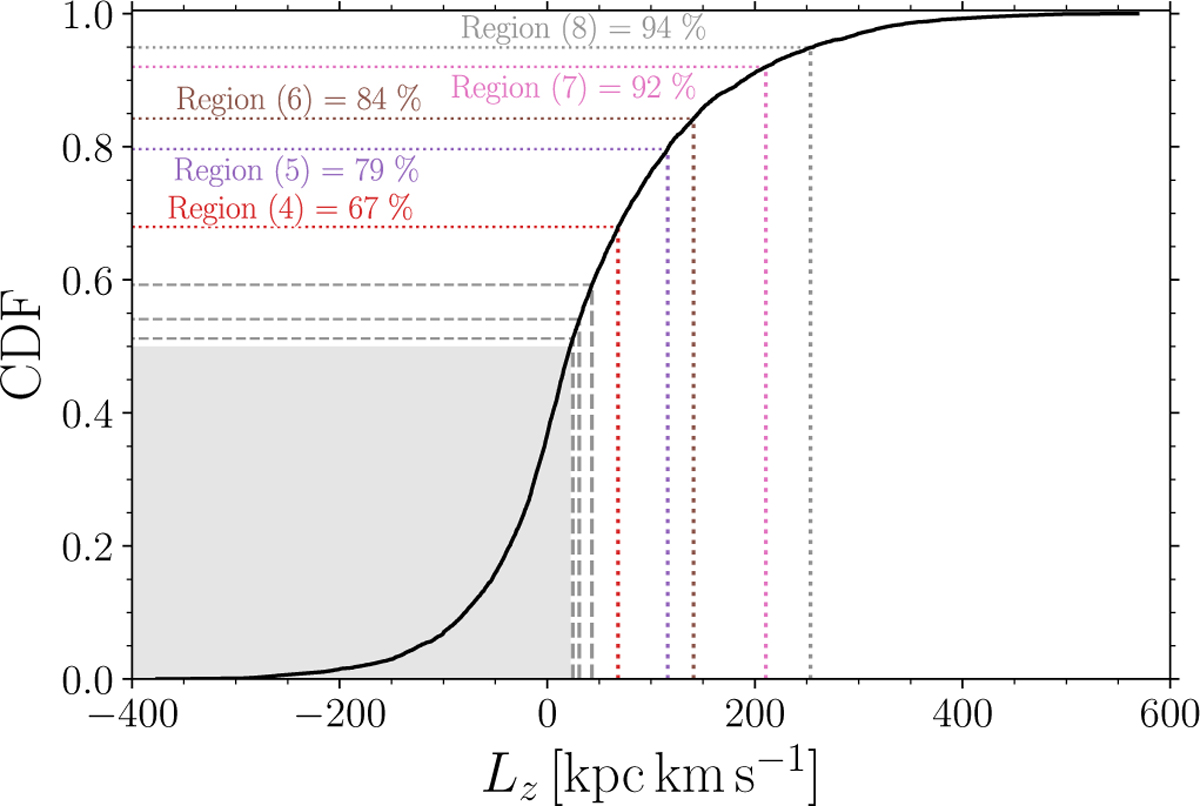
Fig. D.2
Download original image
Cumulative distribution of Lz for bulge RR Lyrae stars (black solid line). The dotted color lines (same as depicted in Figure 13) represent median angular momentum values for the regular orbits in five regions (4, 5, 6, 7, and 8). The dashed lines and gray lines depict median Lz for regions 1, 2, and 3. The filled gray rectangle outlines percentile 50 and lower for Lz.
Current usage metrics show cumulative count of Article Views (full-text article views including HTML views, PDF and ePub downloads, according to the available data) and Abstracts Views on Vision4Press platform.
Data correspond to usage on the plateform after 2015. The current usage metrics is available 48-96 hours after online publication and is updated daily on week days.
Initial download of the metrics may take a while.