Fig. 17
Download original image
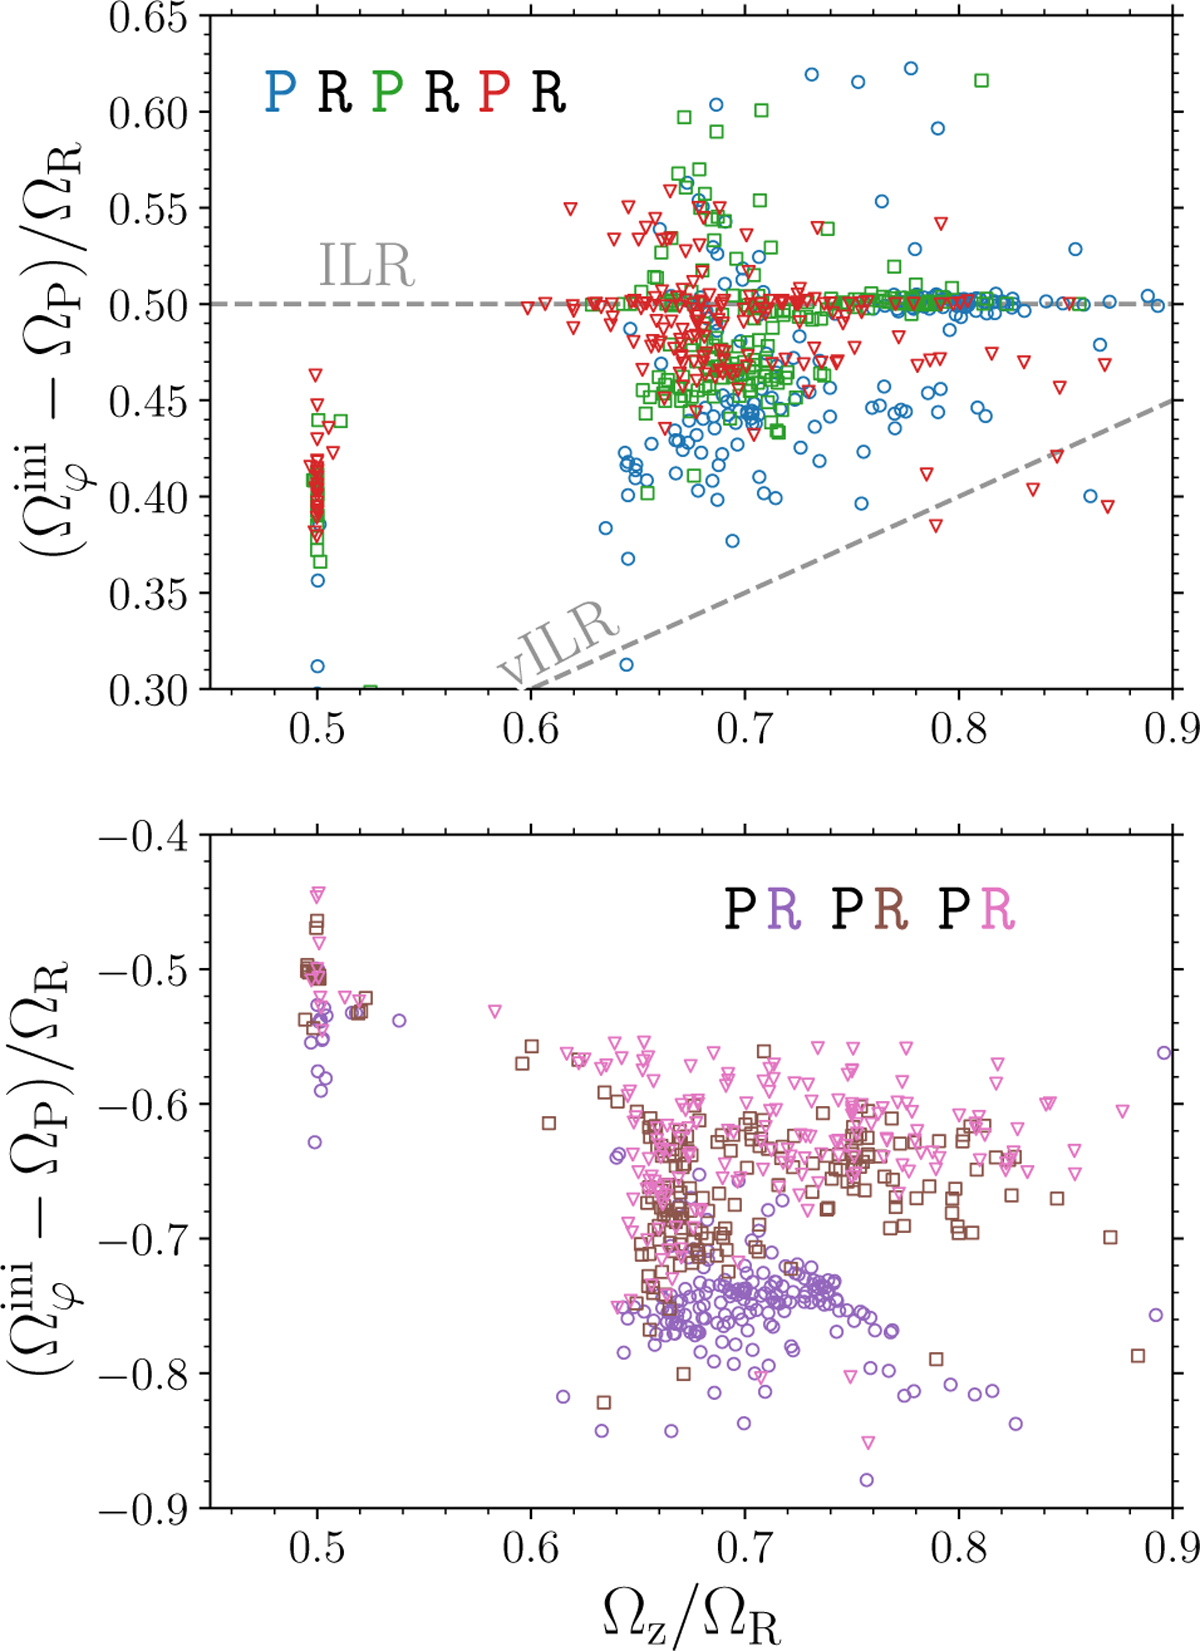
Frequency maps for stellar particles that oscillate between prograde and retrograde orbits with respect to the bar during six analyzed snapshots. In the top panel, we see a frequency map similar to the one in Figure 13 with blue circles (snapshot at 5 Gyr), green squares (snapshot at 7 Gyr) and red triangles (snapshot at 9 Gyr). The bottom panel depicts frequency maps like the one in Figure 14, with purple circles (snapshot at 6 Gyr), brown squares (snapshot at 8 Gyr), and pink triangles (snapshots at 10 Gyr).
Current usage metrics show cumulative count of Article Views (full-text article views including HTML views, PDF and ePub downloads, according to the available data) and Abstracts Views on Vision4Press platform.
Data correspond to usage on the plateform after 2015. The current usage metrics is available 48-96 hours after online publication and is updated daily on week days.
Initial download of the metrics may take a while.