Fig. 8
Download original image
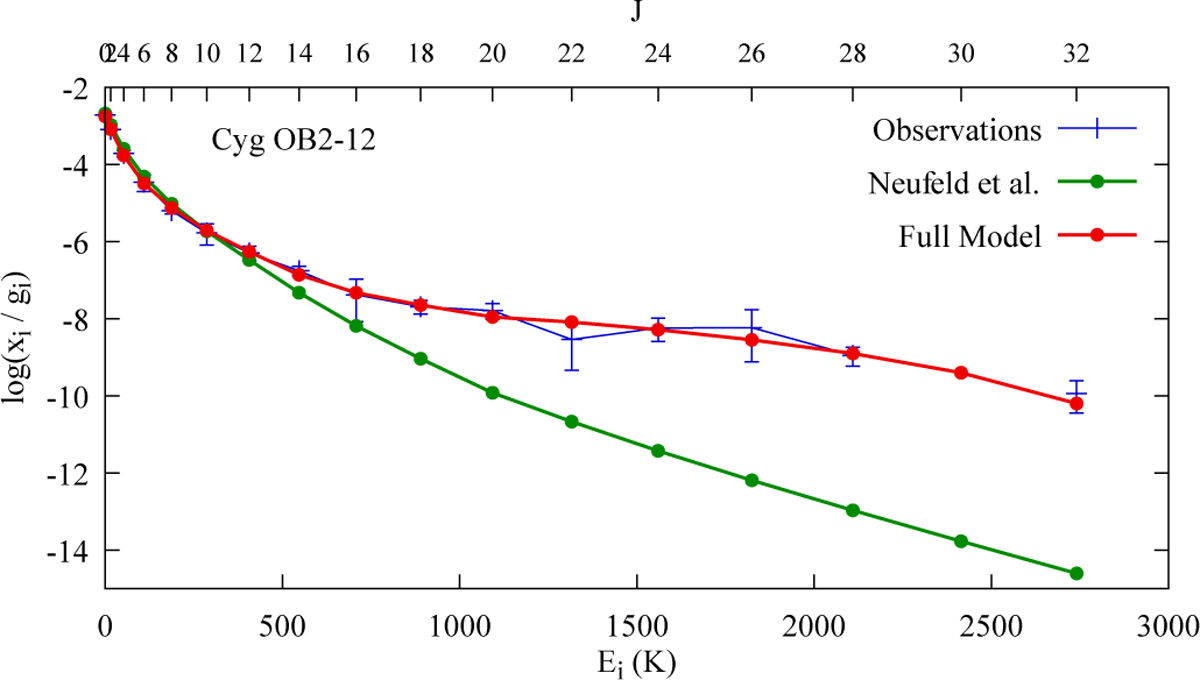
Observed column densities are scaled to [0 : 1] for comparison with local relative populations xJ. The figure shows a comparison between the present observations and model results for Cyg OB2 12. The observed values are in blue. Model results obtained with the physical parameters derived by Neufeld et al. (2024) and the present study (displayed in Table 1) are reported in green and red, respectively.
Current usage metrics show cumulative count of Article Views (full-text article views including HTML views, PDF and ePub downloads, according to the available data) and Abstracts Views on Vision4Press platform.
Data correspond to usage on the plateform after 2015. The current usage metrics is available 48-96 hours after online publication and is updated daily on week days.
Initial download of the metrics may take a while.