Open Access
Fig. 5
Download original image
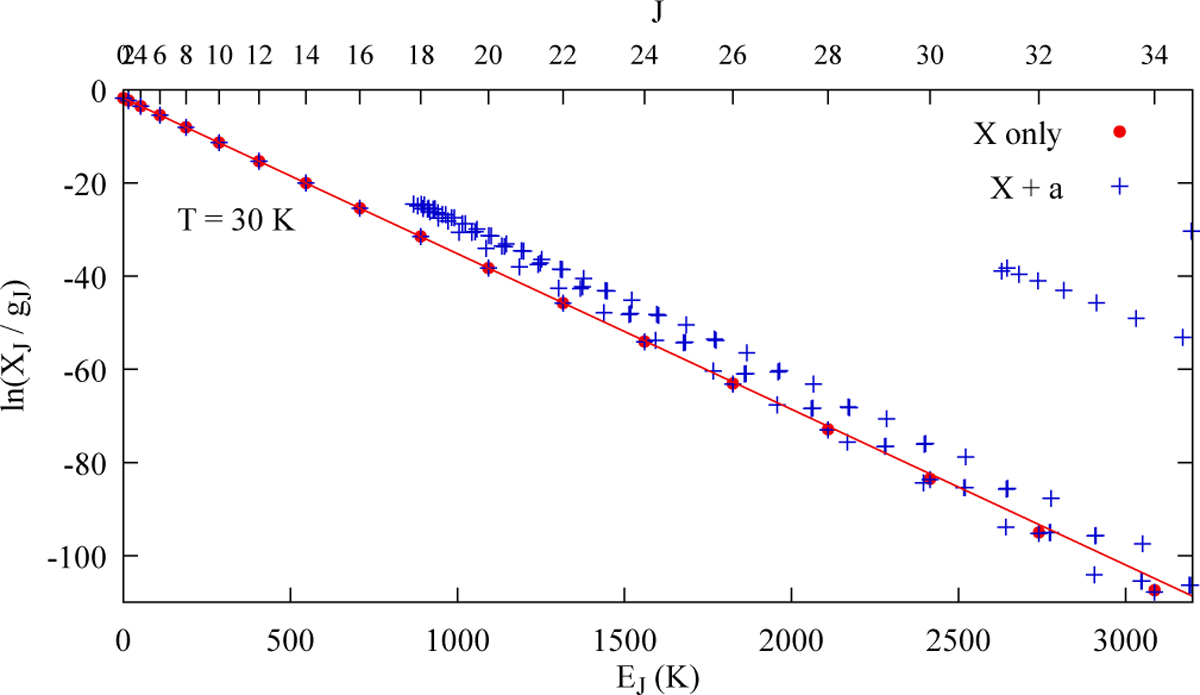
C2 excitation diagram for T = 30K and nH = 50 cm−3 without radiative cascades. Red: Only levels from X included (labeled “X only”); Blue: X and a electronic states, including intercombination transitions (labeled “X + a”).
Current usage metrics show cumulative count of Article Views (full-text article views including HTML views, PDF and ePub downloads, according to the available data) and Abstracts Views on Vision4Press platform.
Data correspond to usage on the plateform after 2015. The current usage metrics is available 48-96 hours after online publication and is updated daily on week days.
Initial download of the metrics may take a while.