Open Access
Fig. 4
Download original image
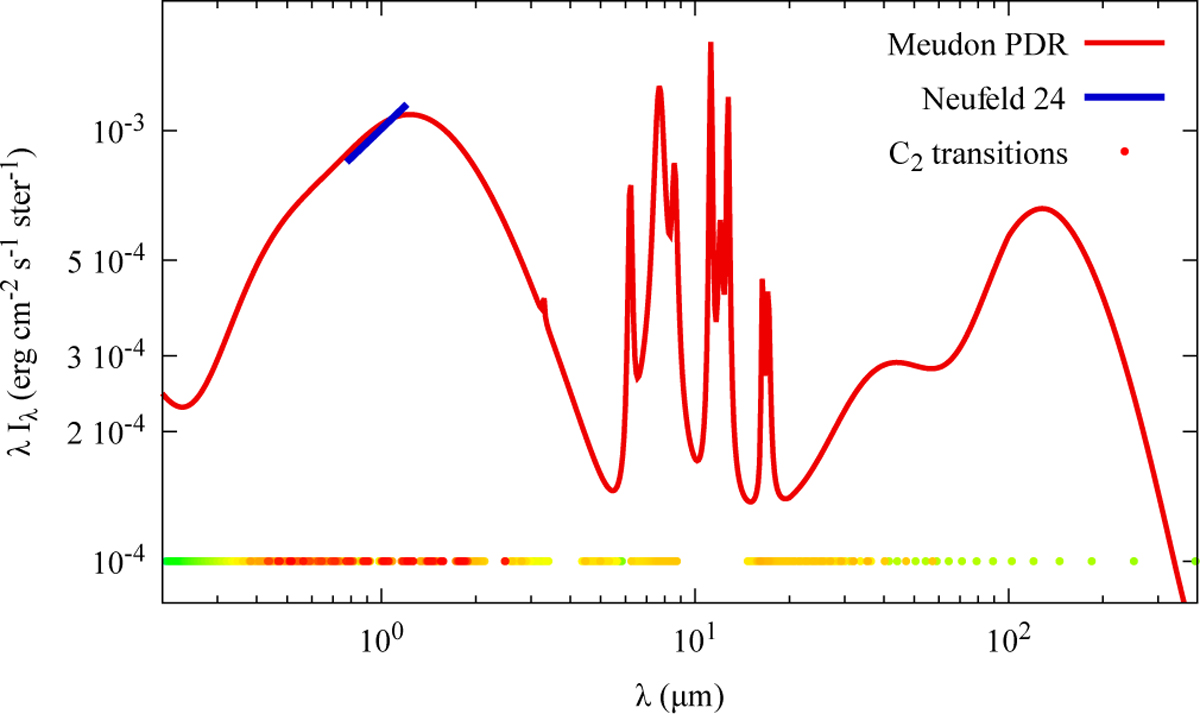
Adopted ISRF for G = 1 in the range of possible transitions of C2. Colored points displayed on the horizontal line at the bottom of the figure indicate the positions of included transitions coded with the value of Blu Jul from red (strongest) to light green (weakest).
Current usage metrics show cumulative count of Article Views (full-text article views including HTML views, PDF and ePub downloads, according to the available data) and Abstracts Views on Vision4Press platform.
Data correspond to usage on the plateform after 2015. The current usage metrics is available 48-96 hours after online publication and is updated daily on week days.
Initial download of the metrics may take a while.