Fig. 9.
Download original image
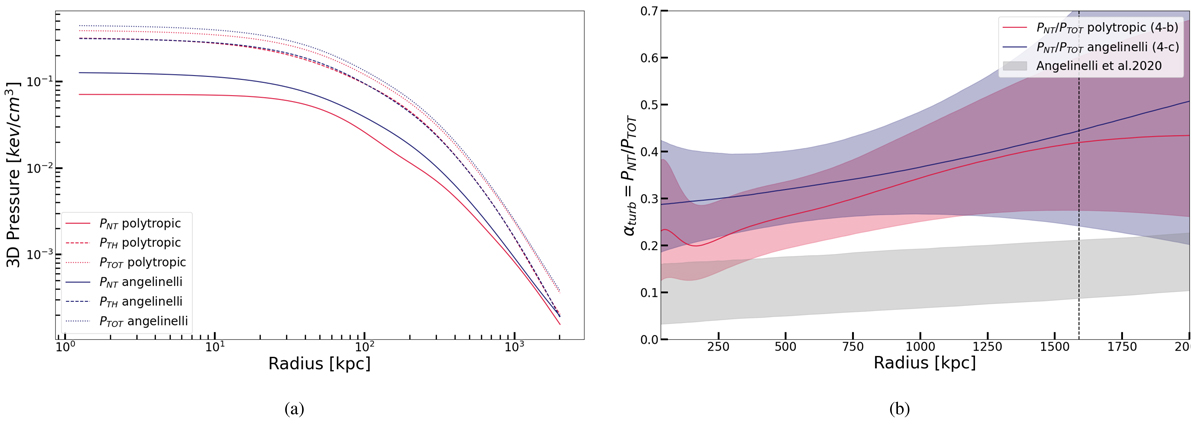
a) Pressure profiles inferred from the A1689 NFW full joint analysis (X-ray, SZ, and WL) of both the polytropic and Angelinelli parameterizations. b) PNT/PTOT ratio for both parameterizations. The grey shaded region denotes the 1σ envelope of the non-thermal pressure profiles derived from 20 simulated clusters in Angelinelli et al. (2020), which were used to inform our prior distributions. The dashed black line marks the radius r500. The radii considered here are the 3D averaged radii.
Current usage metrics show cumulative count of Article Views (full-text article views including HTML views, PDF and ePub downloads, according to the available data) and Abstracts Views on Vision4Press platform.
Data correspond to usage on the plateform after 2015. The current usage metrics is available 48-96 hours after online publication and is updated daily on week days.
Initial download of the metrics may take a while.