Open Access
Fig. 6.
Download original image
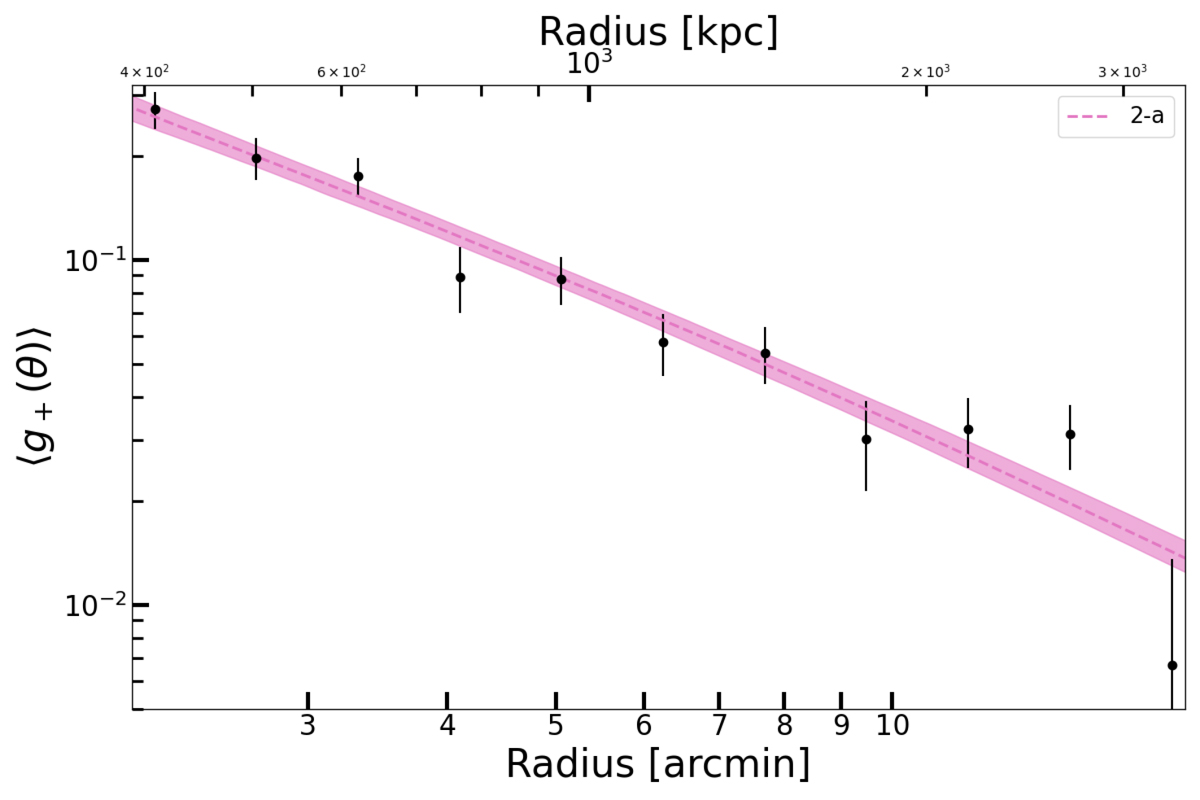
NFW fit of the mean tangential shear profile of A1689 using the weak lensing data only and under spherical symmetry (model 2-a in Table 2). The black data points show the Subaru/HSC reduced tangential shear profile, whereas the pink curve and shaded area represent the best-fit model and 68% error envelope.
Current usage metrics show cumulative count of Article Views (full-text article views including HTML views, PDF and ePub downloads, according to the available data) and Abstracts Views on Vision4Press platform.
Data correspond to usage on the plateform after 2015. The current usage metrics is available 48-96 hours after online publication and is updated daily on week days.
Initial download of the metrics may take a while.