Fig. 5.
Download original image
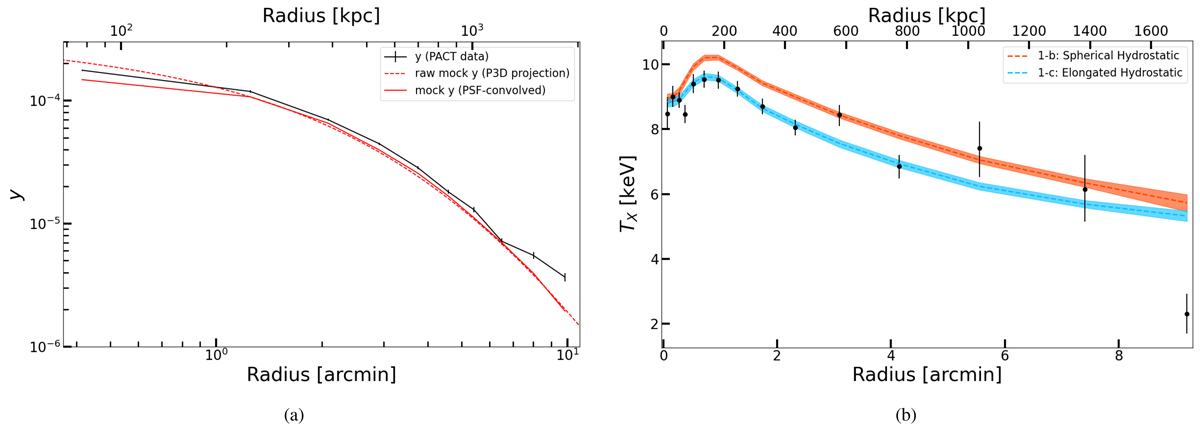
Compton y profile and X-ray temperature profile of A1689. a) The gNFW pressure profile fitted to A1689’s X-ray data is projected and transformed into a Compton y parameter profile (dashed red) and convolved with the Planck + ACT PSF to produce a realistic mock observation (red). This profile is overplotted to the real y profile (black) extracted from Planck + ACT data. b) NFW joint X-ray and SZ analysis of A1689, X-ray temperature profile posterior distributions of 2 models: spherical and elongated (respectively in orange and light blue, model names 1-b and 1-c in Table 2). The results of the analysis as a posterior model distribution on the SZ y parameter and X-ray brightness profiles for both models can be found in the Appendix.
Current usage metrics show cumulative count of Article Views (full-text article views including HTML views, PDF and ePub downloads, according to the available data) and Abstracts Views on Vision4Press platform.
Data correspond to usage on the plateform after 2015. The current usage metrics is available 48-96 hours after online publication and is updated daily on week days.
Initial download of the metrics may take a while.