Fig. B.7.
Download original image
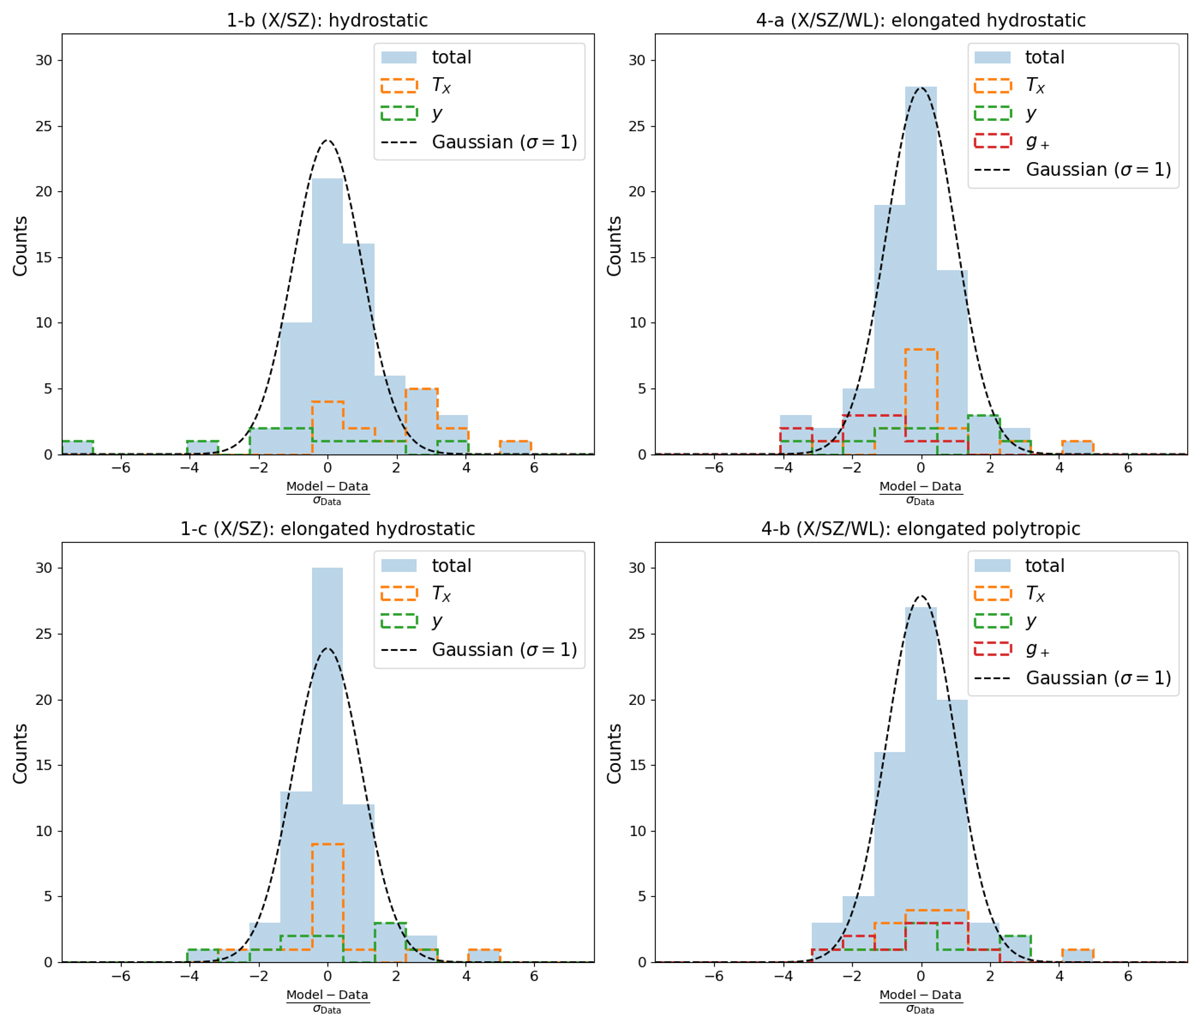
Comparison of the histograms of the residuals (![]() ) for the joint X-ray and SZ analysis (left column) with and without elongation (respectively models 1-b and 1-c, top and bottom panels) and the joint joint X-ray, SZ, and WL analysis (right column) with and without non-thermal pressure (respectively models 4-a and 4-b, top and bottom panels, both accounting for elongation). The blue shaded areas show the total residuals over all the profiles: SX, TX, y (and g+ for the right column) while the dashed colored lines show the individual residuals for TX (orange), y (green) and g+ (red). We also display as a dashed black line a Gaussian with σ = 1 and normalized by the area of the total residuals.
) for the joint X-ray and SZ analysis (left column) with and without elongation (respectively models 1-b and 1-c, top and bottom panels) and the joint joint X-ray, SZ, and WL analysis (right column) with and without non-thermal pressure (respectively models 4-a and 4-b, top and bottom panels, both accounting for elongation). The blue shaded areas show the total residuals over all the profiles: SX, TX, y (and g+ for the right column) while the dashed colored lines show the individual residuals for TX (orange), y (green) and g+ (red). We also display as a dashed black line a Gaussian with σ = 1 and normalized by the area of the total residuals.
Current usage metrics show cumulative count of Article Views (full-text article views including HTML views, PDF and ePub downloads, according to the available data) and Abstracts Views on Vision4Press platform.
Data correspond to usage on the plateform after 2015. The current usage metrics is available 48-96 hours after online publication and is updated daily on week days.
Initial download of the metrics may take a while.