Fig. 1.
Download original image
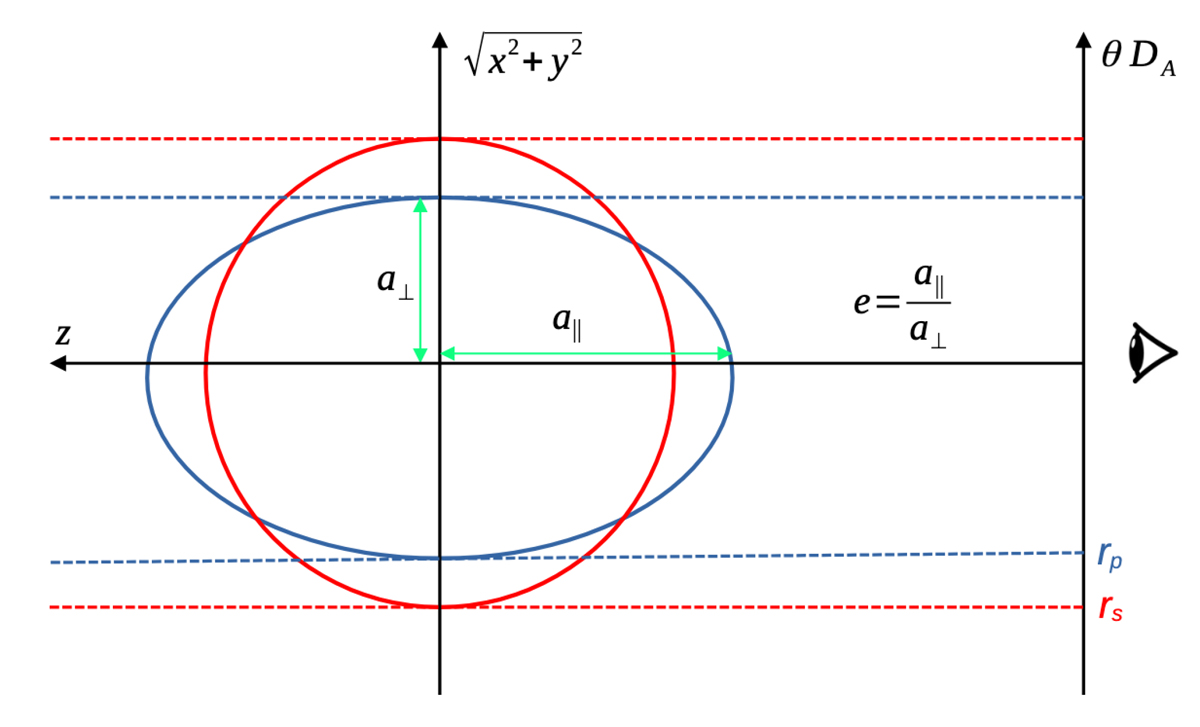
Sketch of the implemented elongation correction. The sketch shows the isodensity surface of an ellipsoidal halo (blue solid curve) in the LOS (z) – plane of the sky (![]() ), compared with a spherical halo with the same 3D radially-averaged profile (red solid line). The projected profile (dashed lines) is boosted by a factor e = a∥/a⊥ and compressed on the plane of the sky by a factor rs/rp = e1/3 (Eqs. (30) and (34)).
), compared with a spherical halo with the same 3D radially-averaged profile (red solid line). The projected profile (dashed lines) is boosted by a factor e = a∥/a⊥ and compressed on the plane of the sky by a factor rs/rp = e1/3 (Eqs. (30) and (34)).
Current usage metrics show cumulative count of Article Views (full-text article views including HTML views, PDF and ePub downloads, according to the available data) and Abstracts Views on Vision4Press platform.
Data correspond to usage on the plateform after 2015. The current usage metrics is available 48-96 hours after online publication and is updated daily on week days.
Initial download of the metrics may take a while.