Open Access
Fig. C.1
Download original image
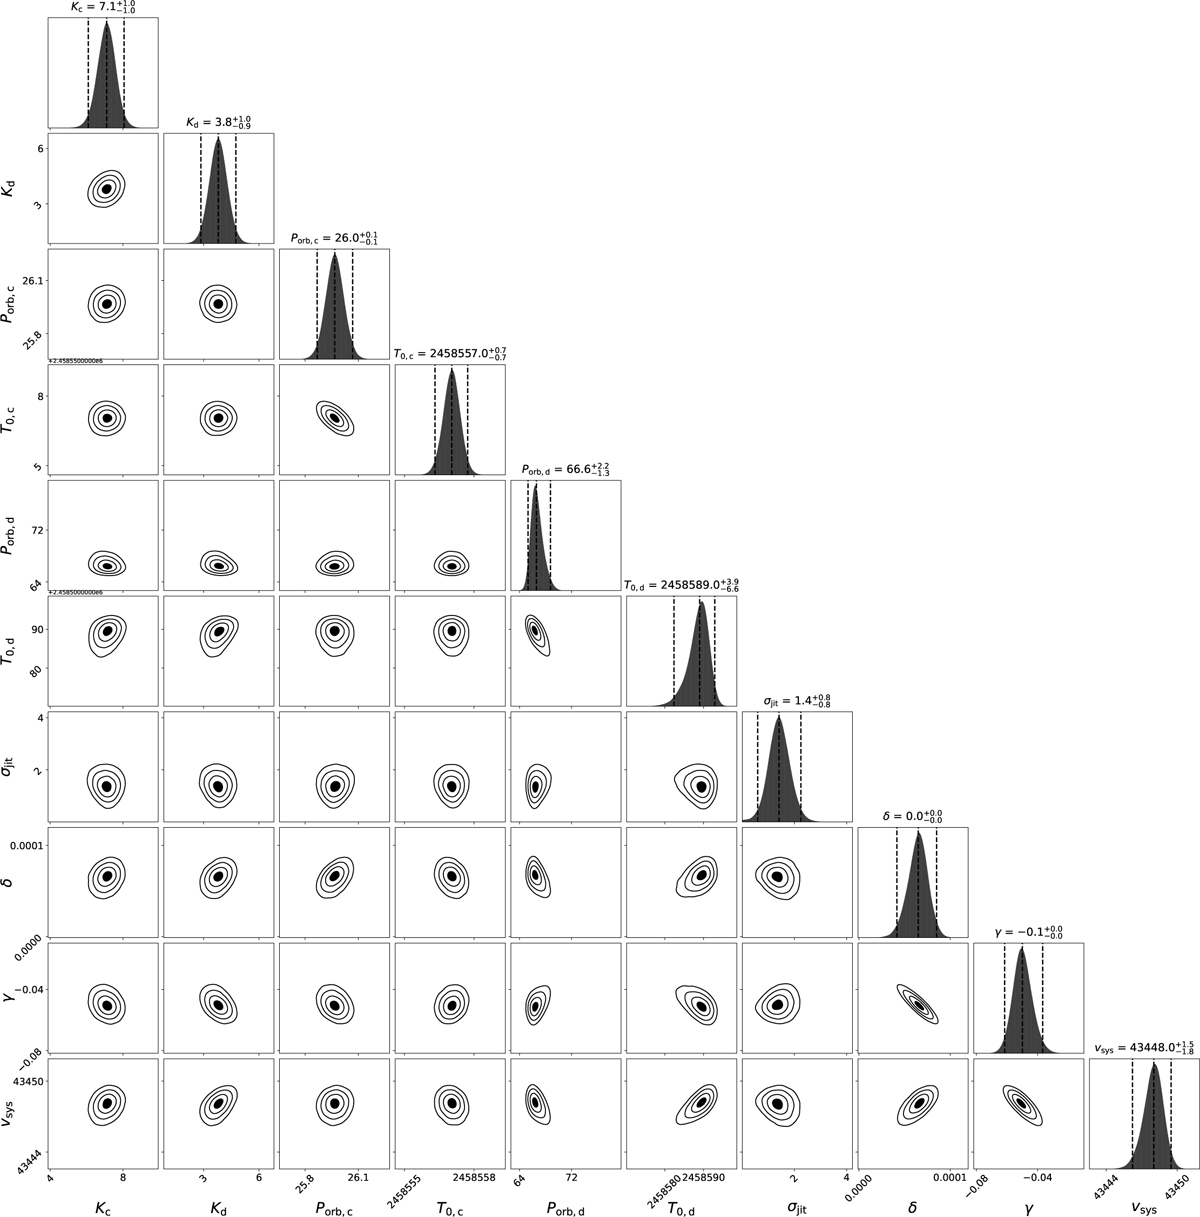
Corner plot with the 1D and 2D posterior distributions of the parameters of the model that best describes the RVs: 2plc2cQ (i.e. 2 planets with circular orbits plus a quadratic trend; see Sect. 4.2). The vertical lines indicate the median and 2σ intervals.
Current usage metrics show cumulative count of Article Views (full-text article views including HTML views, PDF and ePub downloads, according to the available data) and Abstracts Views on Vision4Press platform.
Data correspond to usage on the plateform after 2015. The current usage metrics is available 48-96 hours after online publication and is updated daily on week days.
Initial download of the metrics may take a while.