Fig. A.9
Download original image
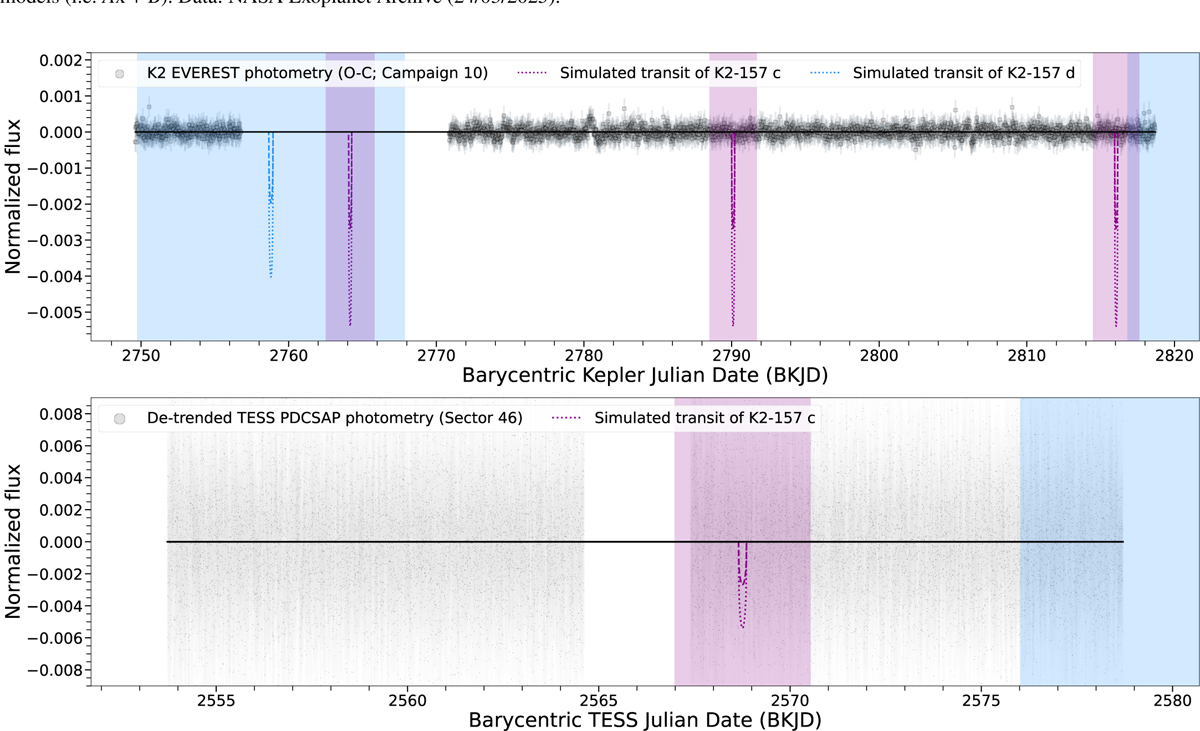
Predicted transit times of K2-157 c and K2-157 d along the K2 (CIO, upper panel) and TESS (S46, lower panel) observing baselines, obtained from our RV-derived ephemeris (Table B.5). Shaded regions represent the lσ confidence intervals. The dotted (dashed) simulated transits assume the median (lσ lower limit) Rp/R★ as estimated by forecaster (Chen & Kipping 2017).
Current usage metrics show cumulative count of Article Views (full-text article views including HTML views, PDF and ePub downloads, according to the available data) and Abstracts Views on Vision4Press platform.
Data correspond to usage on the plateform after 2015. The current usage metrics is available 48-96 hours after online publication and is updated daily on week days.
Initial download of the metrics may take a while.