Open Access
Fig. A.7
Download original image
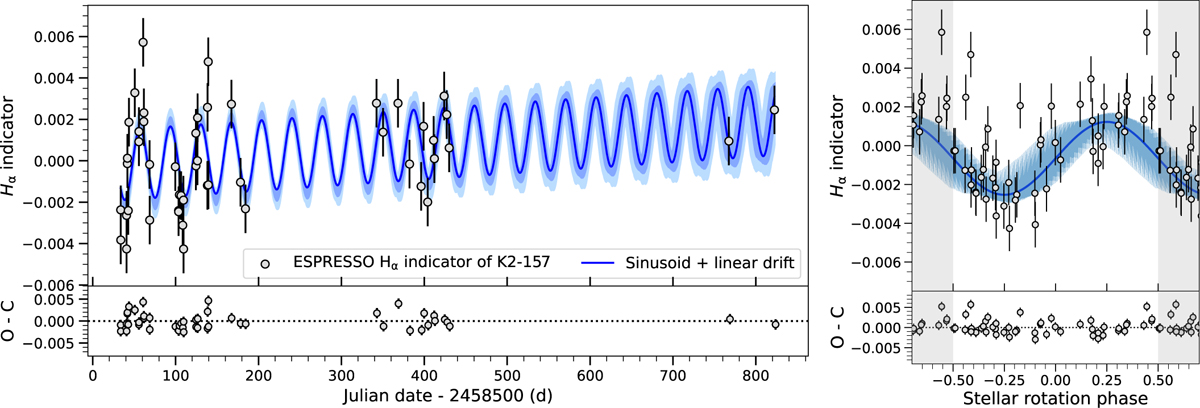
ESPRESSO Hα indicator of K2-157. The solid line represents the median posterior sinusoidal model, and the dark and light shades represent the 1σ and 3σ confidence intervals, respectively. The left panel contains the full data set, and the right panel contains the Hα data folded to the inferred periodicity (![]() d).
d).
Current usage metrics show cumulative count of Article Views (full-text article views including HTML views, PDF and ePub downloads, according to the available data) and Abstracts Views on Vision4Press platform.
Data correspond to usage on the plateform after 2015. The current usage metrics is available 48-96 hours after online publication and is updated daily on week days.
Initial download of the metrics may take a while.