Fig. A.6
Download original image
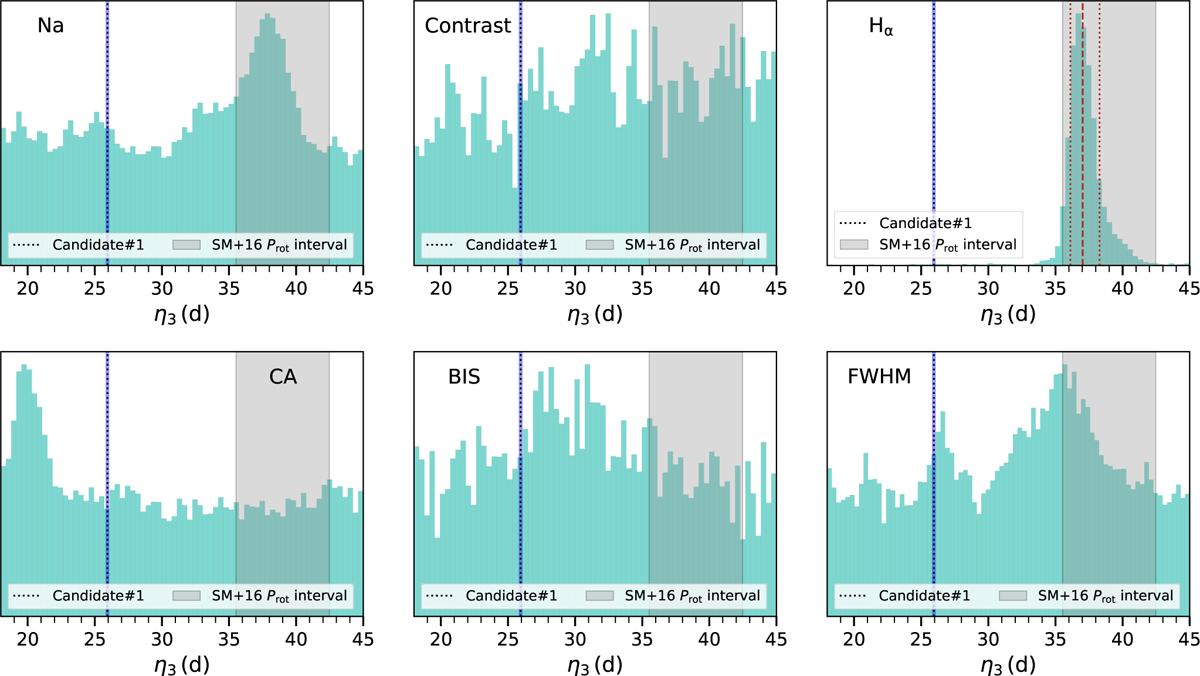
Posterior distribution of the η3 hyperparameter of the quasiperiodic GP kernel used to describe the ESPRESSO activity indicators (Sect. 4.3). The vertical dash-dotted black line indicates the orbital period of Candidate#l and the vertical blue shade indicates its 3σ confidence interval. The vertical grey shade represents the lσ confidence interval of the expected Prot, inferred through the (![]() )-Prot relations from Suárez Mascareño et al. (2016). In the Hα panel, the vertical dashed and dotted brown lines indicate the median value and the 1σ confidence intervals of the distribution, respectively (
)-Prot relations from Suárez Mascareño et al. (2016). In the Hα panel, the vertical dashed and dotted brown lines indicate the median value and the 1σ confidence intervals of the distribution, respectively (![]() d).
d).
Current usage metrics show cumulative count of Article Views (full-text article views including HTML views, PDF and ePub downloads, according to the available data) and Abstracts Views on Vision4Press platform.
Data correspond to usage on the plateform after 2015. The current usage metrics is available 48-96 hours after online publication and is updated daily on week days.
Initial download of the metrics may take a while.