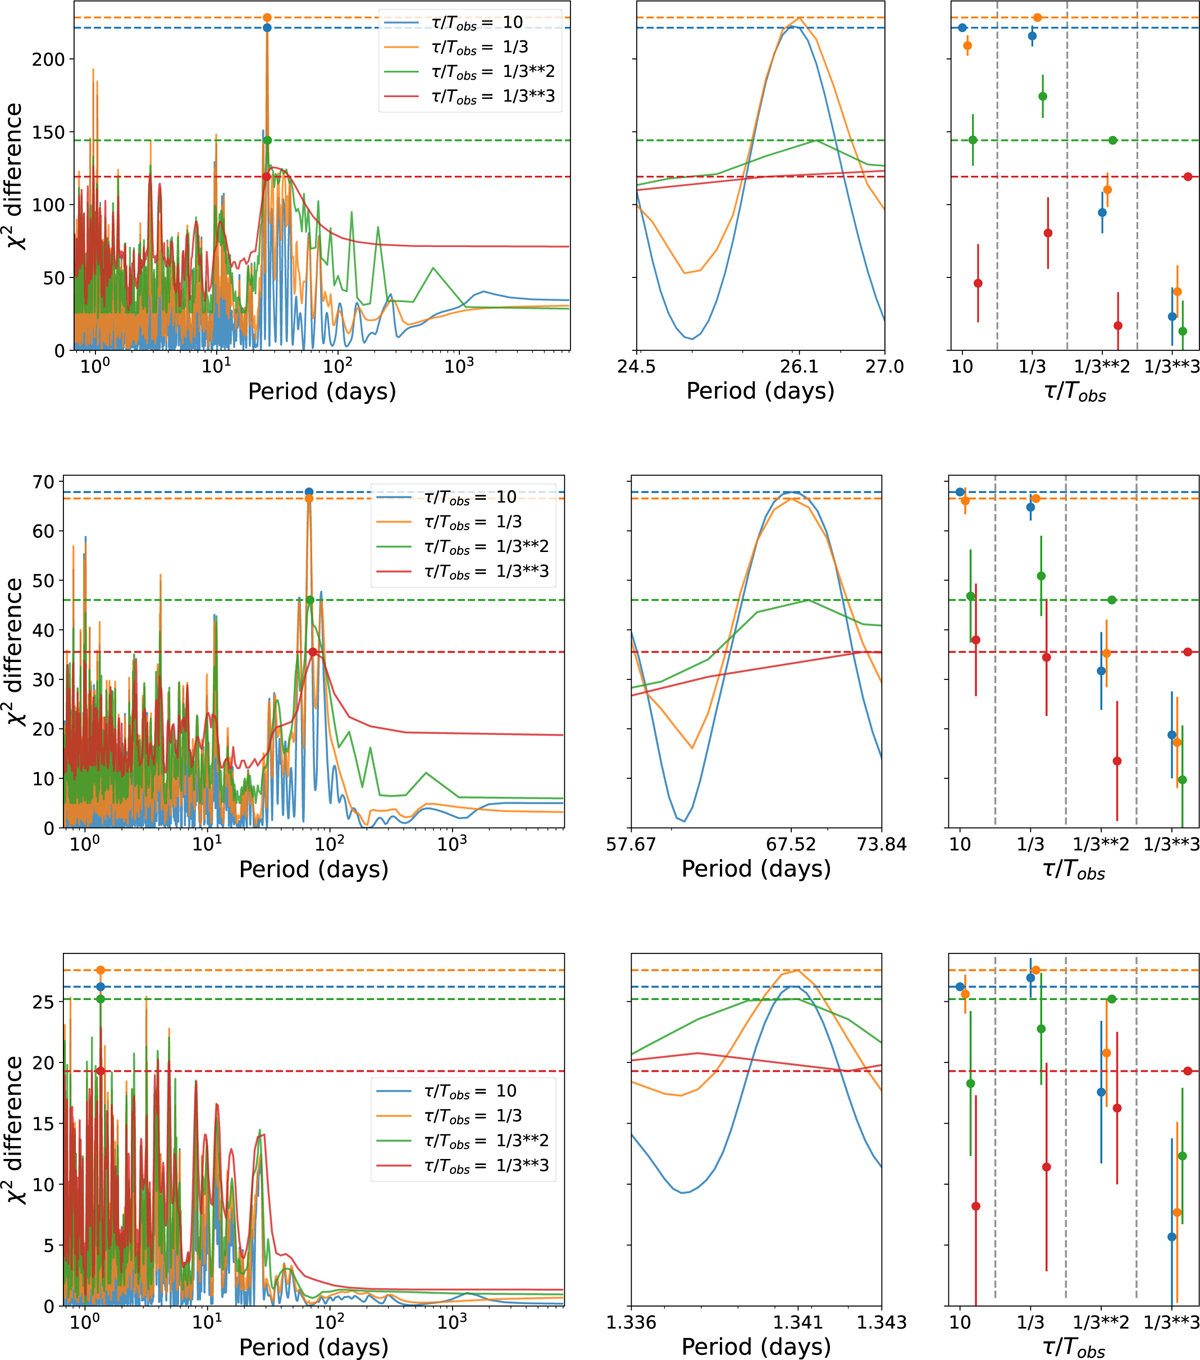
Fig. A.5
Download original image
First three iterations of the apodized sine periodograms (ASPs) method. Models correspond to the maximum of the ASPs. Tobs designates the timespan between the first and last RV observation, and τ has the same meaning as in Eq. (1). The left panels represent the periodograms, the middle panels show a zoom in on the highest peak, and the right-hand panels represent a statistical significance test (see Hara et al. 2022, for details). We note that the best fitting τ for the 26 d signal is not the longest. We attribute this to the sequential fitting. In the first iteration, the 69 d signal is not removed. Because there are only 49 RV measurements, the aliasing is strong, and the presence of the 69 d signal in the first iteration creates interferences. If we first remove the 69 d signal, the longest timescale has the same statistical significance as τ/Tobs = 3.
Current usage metrics show cumulative count of Article Views (full-text article views including HTML views, PDF and ePub downloads, according to the available data) and Abstracts Views on Vision4Press platform.
Data correspond to usage on the plateform after 2015. The current usage metrics is available 48-96 hours after online publication and is updated daily on week days.
Initial download of the metrics may take a while.