Fig. A.2
Download original image
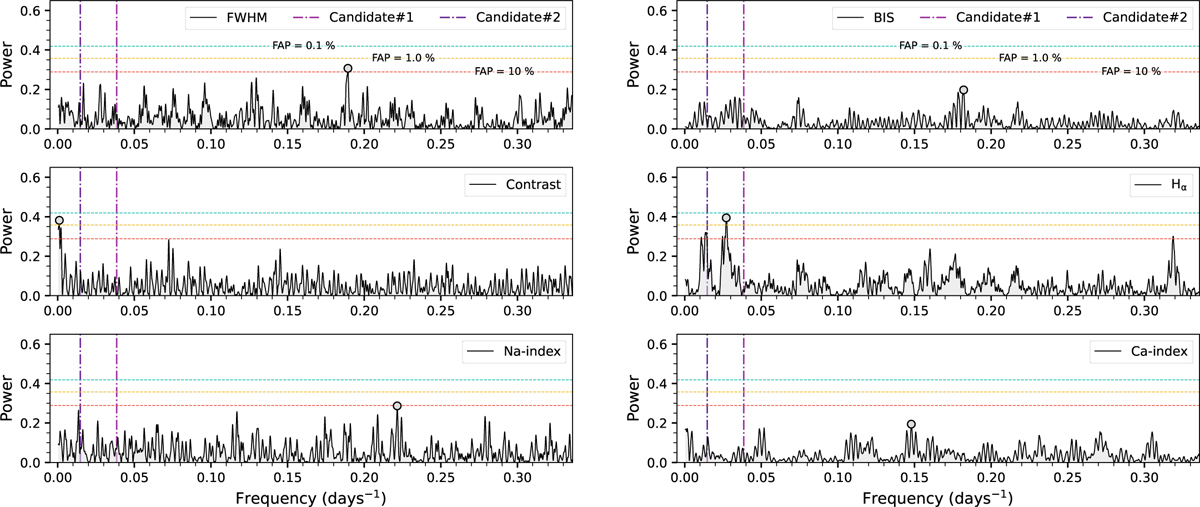
Generalized Lomb-Scargle periodograms (GLS) of the ESPRESSO activity indicators of K2-157. The grey circles indicate the maximum power frequencies. The vertical dash-dotted lines indicate the frequencies of the sinusoidal periodicities of Candidate#l and Candidate#2. The horizontal dotted lines show the 10%, 1%, and 0.1% FAP levels.
Current usage metrics show cumulative count of Article Views (full-text article views including HTML views, PDF and ePub downloads, according to the available data) and Abstracts Views on Vision4Press platform.
Data correspond to usage on the plateform after 2015. The current usage metrics is available 48-96 hours after online publication and is updated daily on week days.
Initial download of the metrics may take a while.