Fig. 13

Download original image
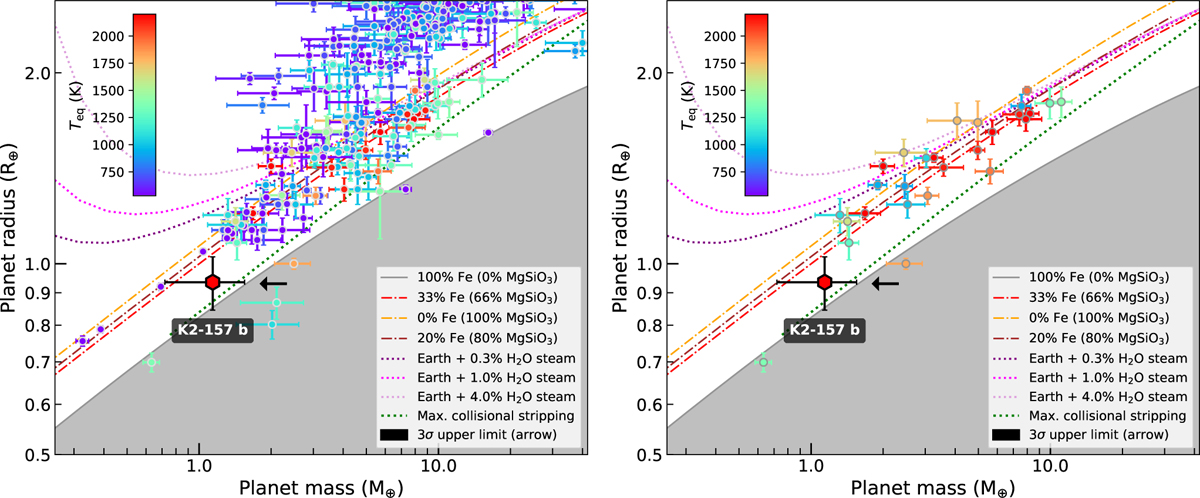
Mass-radius diagram of all small planets (left) and USP planets (right) with masses and radii constrained to a precision better than 35 and 20%, respectively. The colour code represents the measured equilibrium temperatures. In both panels, we represent different composition curves for rocky planets derived in Marcus et al. (2010); Zeng et al. (2016, 2019); Turbet et al. (2020). The black arrow indicates the 3σ upper limit of K2-157 b’s mass: 2.3 M⊕. Data: NASA Exoplanet Archive (24/03/2025). This plot was generated with mr-plotter (https://github.com/castro-gzlz/mr-plotter; Castro-González et al. 2023).
Current usage metrics show cumulative count of Article Views (full-text article views including HTML views, PDF and ePub downloads, according to the available data) and Abstracts Views on Vision4Press platform.
Data correspond to usage on the plateform after 2015. The current usage metrics is available 48-96 hours after online publication and is updated daily on week days.
Initial download of the metrics may take a while.


