Fig. 12
Download original image
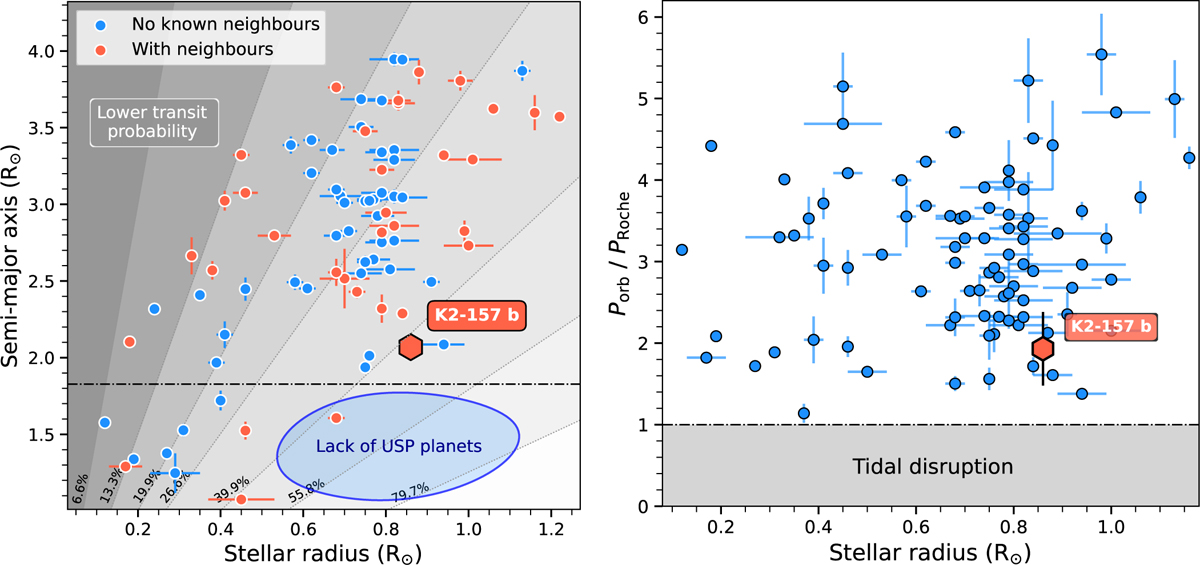
Left: semi-major axis versus stellar radius of small USP planets (RP < 2 R⊕), where we highlight a lack of planets that cannot be explained through observational bias, ![]() au (1.8 R⊙) and
au (1.8 R⊙) and ![]() . The dotted grey lines trace iso-probability transit regions. Right: orbital period scaled to the Roche limit for USP rocky planets versus the stellar radius of their host stars, where we can appreciate how the scaled orbital locations do not depend on the stellar spectral types. The horizontal line indicates the tidal disruption limit. Data: NASA Exoplanet Archive (24/03/2025).
. The dotted grey lines trace iso-probability transit regions. Right: orbital period scaled to the Roche limit for USP rocky planets versus the stellar radius of their host stars, where we can appreciate how the scaled orbital locations do not depend on the stellar spectral types. The horizontal line indicates the tidal disruption limit. Data: NASA Exoplanet Archive (24/03/2025).
Current usage metrics show cumulative count of Article Views (full-text article views including HTML views, PDF and ePub downloads, according to the available data) and Abstracts Views on Vision4Press platform.
Data correspond to usage on the plateform after 2015. The current usage metrics is available 48-96 hours after online publication and is updated daily on week days.
Initial download of the metrics may take a while.