Fig. 1
Download original image
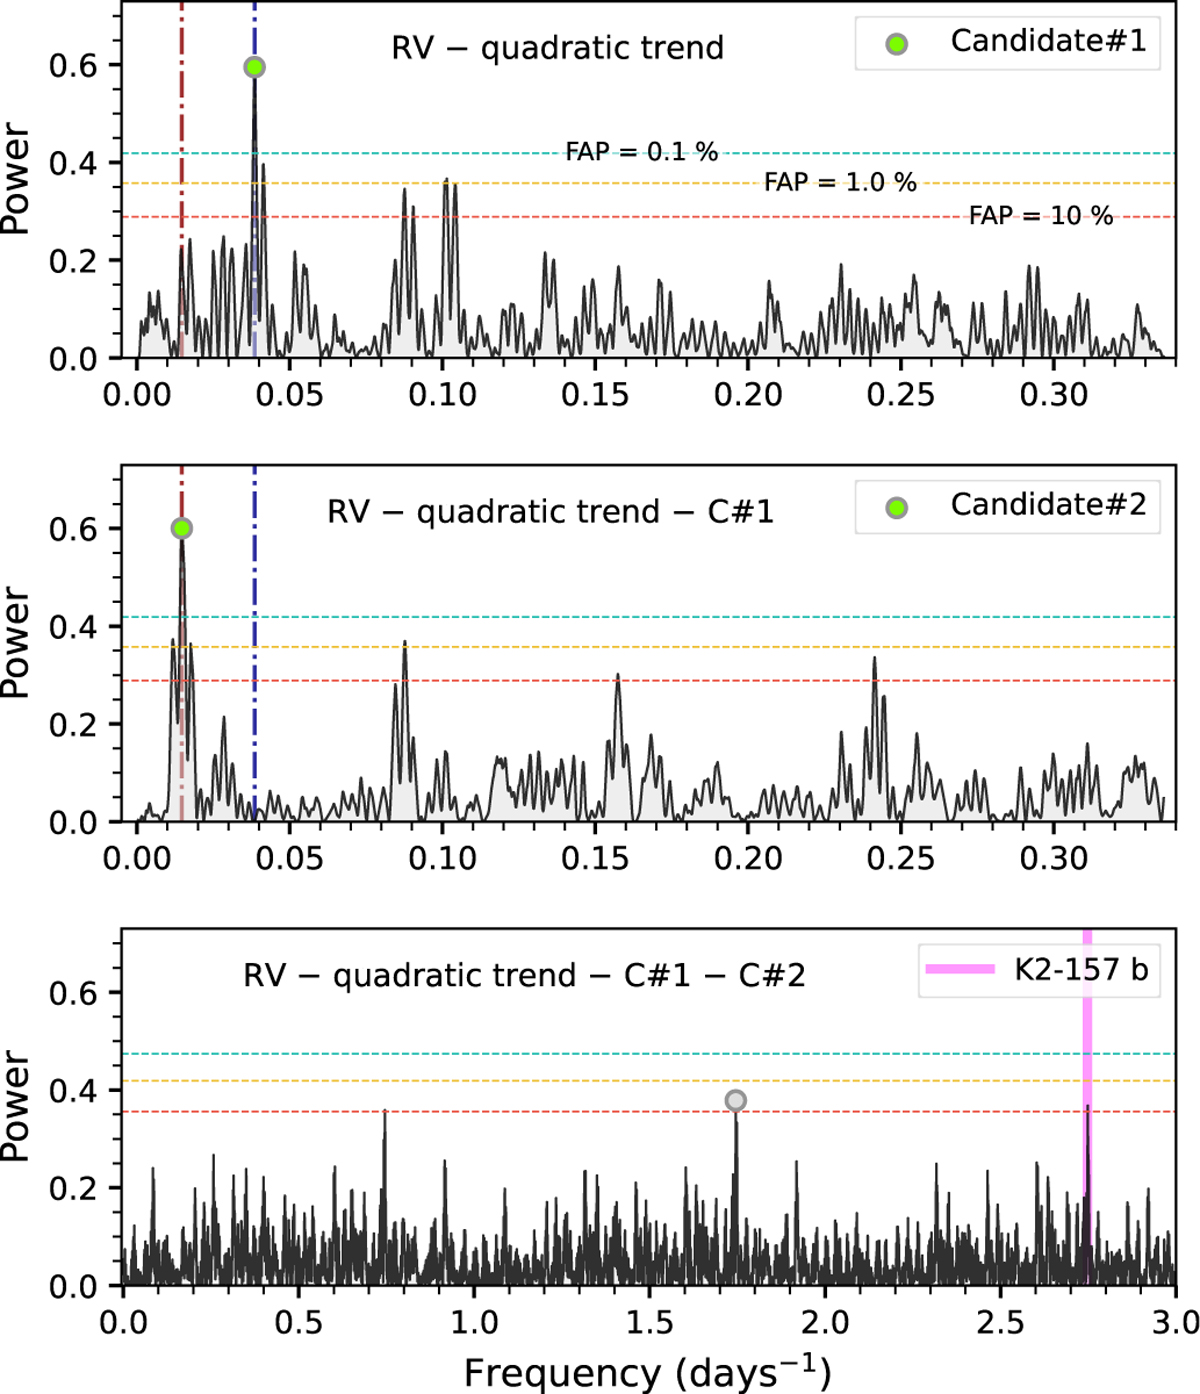
Generalized Lomb-Scargle periodograms of the ESPRESSO RVs of K2-157 after subtracting a quadratic trend (upper panel) and the RV signals of Candidate#1 (C#1; middle panel) and Candidate#2 (C#2; lower panel). The circles indicate the maximum power frequencies and are highlighted in green when they correspond to a significant signal (FAP < 0.1%).
Current usage metrics show cumulative count of Article Views (full-text article views including HTML views, PDF and ePub downloads, according to the available data) and Abstracts Views on Vision4Press platform.
Data correspond to usage on the plateform after 2015. The current usage metrics is available 48-96 hours after online publication and is updated daily on week days.
Initial download of the metrics may take a while.