Fig. 7
Download original image
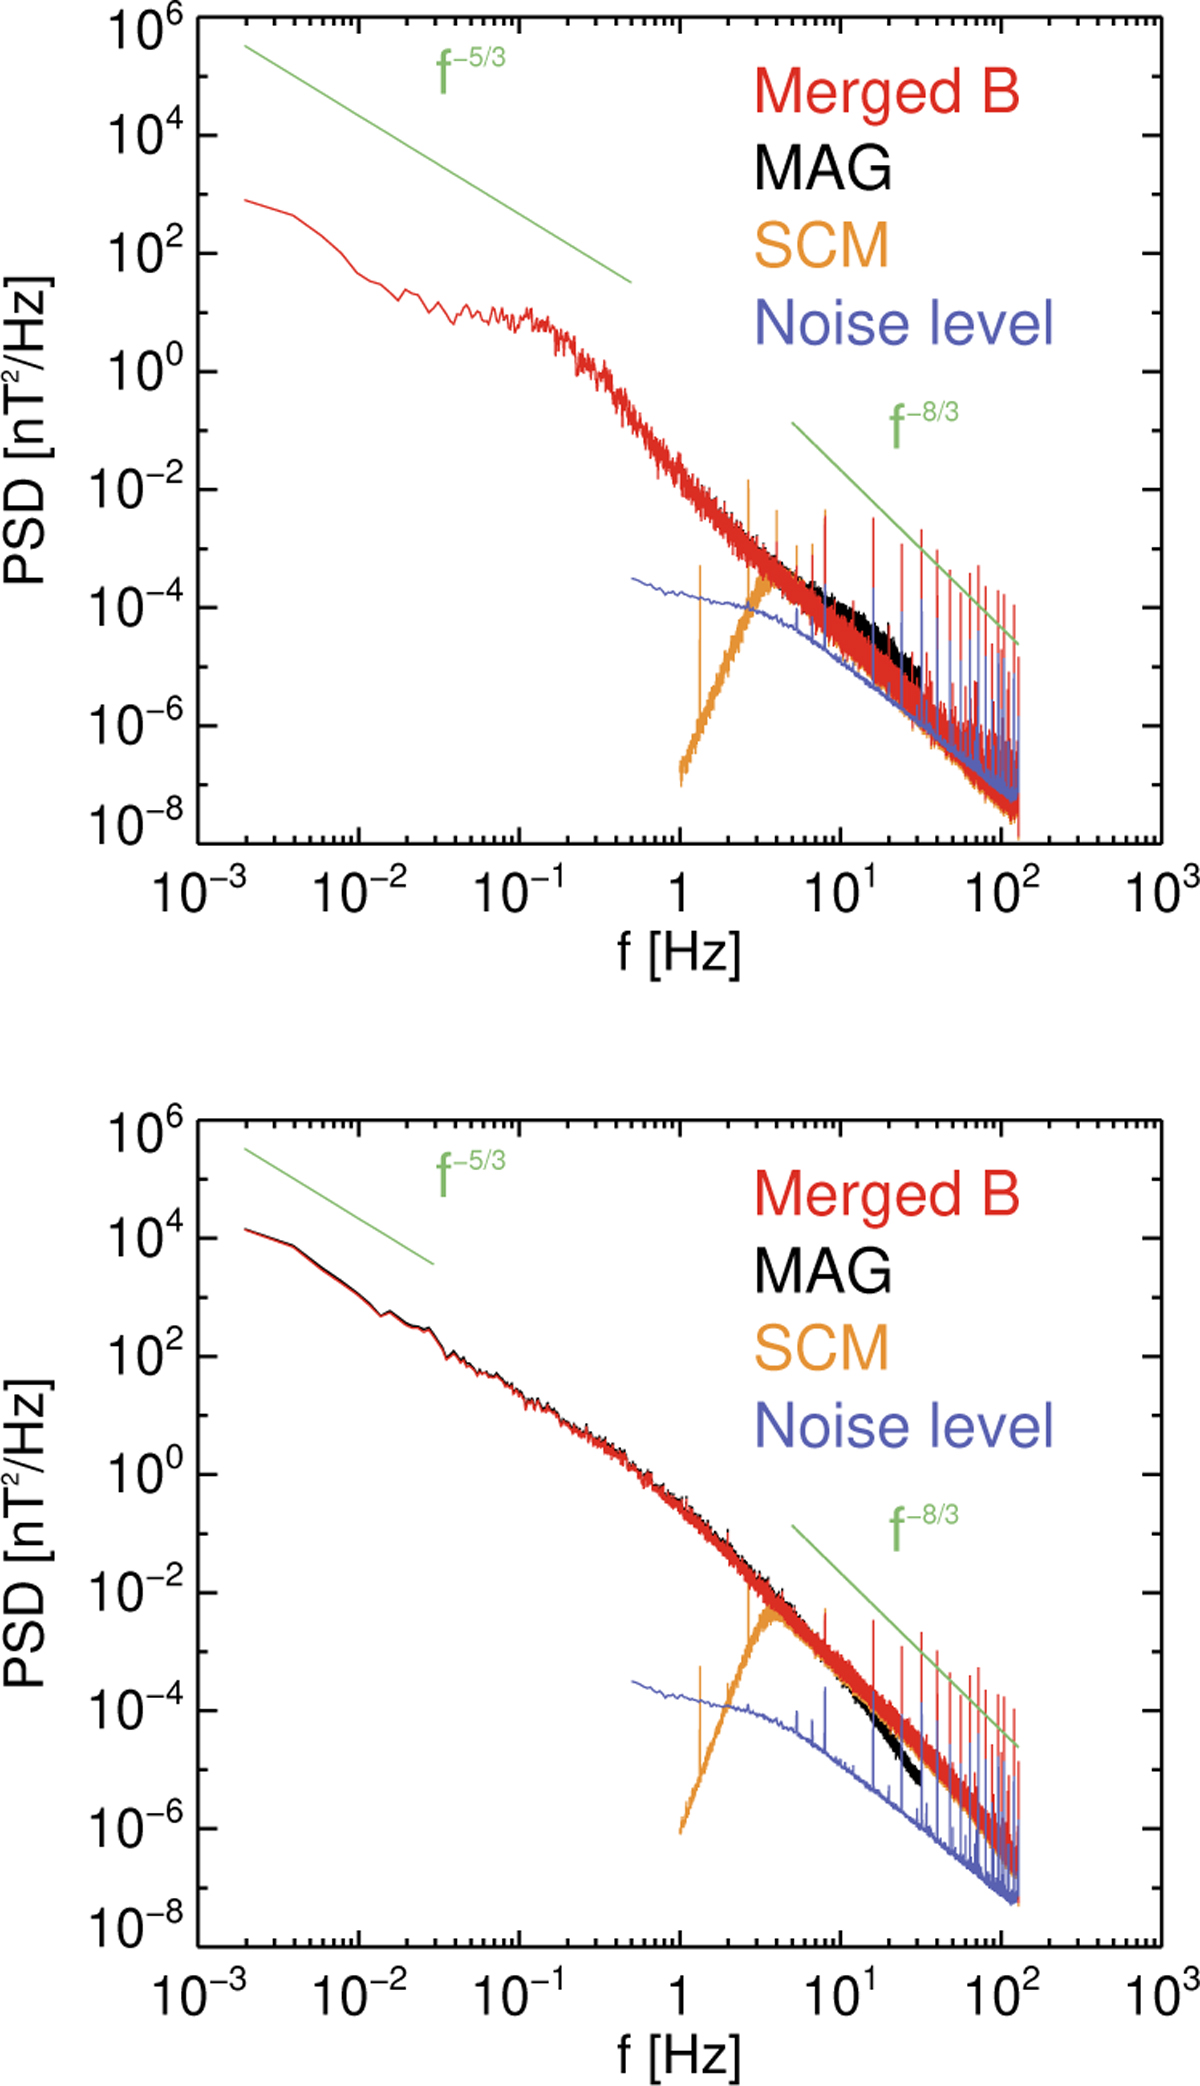
Top panel: power spectral density of the magnetic field computed for September 6 2022 between 2:30pm and 3:30pm, using L2 MAG burst data (black), L2 SCM data (orange), and the merged magnetic field (red). The purple curve is the noise level of the merged product. The f−5/3 and f−8/3 (8/3=2.66) scaling are indicated for visual comparison. Bottom panel: power spectral density for the same day, but between 21:30 and 22:30.
Current usage metrics show cumulative count of Article Views (full-text article views including HTML views, PDF and ePub downloads, according to the available data) and Abstracts Views on Vision4Press platform.
Data correspond to usage on the plateform after 2015. The current usage metrics is available 48-96 hours after online publication and is updated daily on week days.
Initial download of the metrics may take a while.