| Issue |
A&A
Volume 699, July 2025
|
|
|---|---|---|
| Article Number | A119 | |
| Number of page(s) | 8 | |
| Section | Astrophysical processes | |
| DOI | https://doi.org/10.1051/0004-6361/202554601 | |
| Published online | 02 July 2025 | |
Swift/XRT monitoring of the orbital and superorbital modulations in 4U 1909+07
1
INAF – Osservatorio Astronomico di Brera, Via E. Bianchi 46, I-23807 Merate, Italy
2
Catholic University of America, 620 Michigan Ave NE, Washington, DC 20064, USA
3
Center for Space Science and Technology, University of Maryland, Baltimore County, 1000 Hilltop Circle, Baltimore, MD 21250, USA
4
X-ray Astrophysics Laboratory, NASA Goddard Space Flight Center, Greenbelt, MD 20771, USA
5
Department of Astronomy, Université de Genève, 16 chemin d’Écogia, 1290 Versoix, Switzerland
6
George Washington University, Washington, DC 20052, USA
7
CRESST and CSST, University of Maryland, Baltimore County, 1000 Hilltop Circle, Baltimore, MD 21250, USA
8
Maryland Institute College of Art, 1300 W Mt Royal Ave, Baltimore, MD 21217, USA
9
Department of Physics and Astronomy, Howard University, Washington, DC 20059, USA
10
CRESST/Astroparticle Physics Laboratory, Code 661, NASA Goddard Space Flight Center, Greenbelt Road, MD 20771, USA
11
University of Maryland, Baltimore County, MD 21250, USA
⋆ Corresponding author: This email address is being protected from spambots. You need JavaScript enabled to view it.
Received:
18
March
2025
Accepted:
2
May
2025
Abstract
We report on an observational campaign conducted with Swift/X-ray Telescope (XRT) on the wind-fed supergiant X-ray binary 4U 1909+07 to investigate the nature of the orbital and superorbital modulation of its X-ray emission. A total of 137 XRT observations were carried out, resulting in a total effective exposure time of 114 ks and covering 66 orbital and 19 superorbital cycles of the source. The XRT data folded on the orbital period of the source confirm and improve the previously reported variability in intensity and absorption column density, which can be ascribed to the neutron star accreting from the wind of its B supergiant companion across a nearly circular orbit. The XRT data folded on the superorbital period do not show significant variations in either the absorption column density and/or the power-law photon index. This may be due to a significant weakening of the superorbital modulation during the period of the XRT observations, as confirmed by the Burst Alert Telescope dynamic power spectrum. We discuss the implications of these findings within the corotating interaction region model proposed to interpret the superorbital variability in wind-fed supergiant X-ray binaries.
Key words: stars: neutron / pulsars: individual: 4U 1909+07 / X-rays: binaries
© The Authors 2025
 Open Access article, published by EDP Sciences, under the terms of the Creative Commons Attribution License (https://creativecommons.org/licenses/by/4.0), which permits unrestricted use, distribution, and reproduction in any medium, provided the original work is properly cited.
This article is published in open access under the Subscribe to Open model. This email address is being protected from spambots. You need JavaScript enabled to view it. to support open access publication.
1. Introduction
Superorbital modulation has been detected in various X-ray binaries hosting both black hole and neutron star accretors. These modulations manifest as periodic changes in the X-ray luminosity of the system on timescales that are typically a few times longer than those associated with orbital revolutions (see, e.g., Corbet & Krimm 2013; Corbet et al. 2021, and references therein). In disk-fed binaries, superorbital modulations are often ascribed to accretion disk precession (see, e.g. the case of Her X-1, SMC X-1, and LMC X-4; Heyl et al. 2024, and references therein). In wind-fed supergiant X-ray binaries, where the primary star is typically an OB supergiant, interpretations of these phenomena are complicated by the lack of sufficiently large and long-lasting (months to years) structures that could lead to (quasi-) periodic modulations of the mass accretion rate.
Bozzo et al. (2017) propose that superorbital modulations in supergiant wind-fed binaries can be ascribed to so-called corotating interaction regions (CIRs), large-scale structures protruding from the photosphere of the massive star and extending to several stellar radii. These structures result in long-lasting (∼years) density and velocity variations in the surroundings of the OB supergiant, leading to significant modulation of the mass accretion rate onto the compact object, with a periodicity that may significantly exceed the binary orbital period. The model predicts that encounters between the CIR and the compact object result in higher mass accretion rates and enhanced absorption measured along the line of sight to the binary. This occurs because the CIR typically has a density several times greater than that of the surrounding stellar wind, along with a velocity that may differ from that of the smooth stellar wind (see, e.g., Lobel & Blomme 2008, and references therein). Depending on the geometrical configurations, the model by Bozzo et al. (2017) shows that an enhanced absorption column density could be measured before or after the increased X-ray luminosity produced by the compact object interacting with the higher density of the CIR. The augmented X-ray luminosity may also result in subsequent short-term decreases in the local absorption column density, if significant photoionisation of the CIR material occurs during the encounter with the compact object.
To test the applicability of the CIR model to wind-fed supergiant X-ray binaries, Romano et al. (2024) initiated monitoring observations of several such systems with the X-ray Telescope (XRT, Burrows et al. 2005), the X-ray narrow field instrument on board the Neil Gehrels Swift Observatory (Gehrels et al. 2004). The combination of high sensitivity, soft X-ray energy coverage, and scheduling flexibility of XRT has proven highly effective for probing the physics of superorbital modulations. XRT observations, as short as a few hundred seconds, can be periodically scheduled to probe the properties (intensity and spectral energy distribution) of the source X-ray emission at different orbital and superorbital phases over many modulation cycles. This allows us to average out the short-term variability (on timescales of hundreds to thousands of seconds due to clumpy wind accretion; see, e.g. Martínez-Núñez et al. 2017; Kretschmar et al. 2019, and references therein) and reveal the changes in emission properties directly related to the orbital and superorbital variations.
In this article, we extend our previous work (Romano et al. 2024) by presenting a ten-month monitoring campaign performed in 2024 with Swift/XRT on the supergiant wind-fed X-ray binary 4U 1909+07. We report the search for flux and spectral variability in the source’s X-ray emission across orbital and superorbital cycles. We also used the rich archive data provided by the Burst Alert Telescope (BAT, Barthelmy et al. 2005) Transient Monitor (Krimm et al. 2013) to update previously reported results on the source, conducting a long-term investigation into the presence and strength of its orbital and superorbital modulation in hard X-rays over the past ∼20 years.
2. 4U 1909+07
4U 1909+07 is a supergiant wind-fed high-mass X-ray binary hosting a B0-3 I supergiant star (Martínez-Núñez et al. 2015) and a neutron star accreting from its stellar wind. The system has an orbital period of Porb = 4.400 ± 0.001 d. Pulsations from the neutron star were first identified at Pspin ∼ 605 s in the early 2000s (Wen et al. 2000; Levine et al. 2004), and were later shown to exhibit long-term changes (Fürst et al. 2011, 2012; Jaisawal et al. 2013, 2020; Islam et al. 2023, see also Coley et al., in prep., for the most recently evaluated trend). Jaisawal et al. (2013) reported a possible absorption-like feature at 44 keV in Suzaku observations, identified as a cyclotron resonant scattering feature (CRSF), suggesting a neutron star surface magnetic field of 3.8 × 10¹² G. However, the presence of this tentative CRSF was not confirmed by subsequent NuSTAR and AstroSat observations (Jaisawal et al. 2020; Islam et al. 2023). A study of the system’s X-ray luminosity variations as a function of orbital phase was first reported by Levine et al. (2004) using RXTE/PCA data.
The discovery of a superorbital modulation at ∼15.2 d was made possible by exploiting long-term Swift/BAT data and was first reported by Corbet & Krimm (2013). More recently, Islam et al. (2023) combined long-term monitoring of superorbital modulations using BAT data with pointed observations Swift and NuSTAR data to probe possible changes in the intensity of superorbital variability over time, as well as broadband spectral changes that could occur in different superorbital phases. They found that the intensity of the superorbital modulation in the source varies significantly over time, and there are periods when it is barely detectable in the BAT data. They also found marginal evidence of a possible correlation between changes in the spin-periods of 4U 1909+07 and the strength of the superorbital modulations, similar to what has been reported for 4U 1538−52 (Corbet et al. 2021). However, the pulse-period measurements in 4U 1909+07 are still too sparse to draw any firm conclusions. The limited number of pointed Swift and NuSTAR observations collected at one of the expected maxima and minima of the superorbital variability did not reveal significant spectral variations in either the power-law slope or the recorded absorption column density (Coley et al. 2025).
3. Data reduction and analysis
3.1. Swift/XRT
For this work, we combined two sets of Swift/XRT observations. The first set was collected as part of the Swift GI programme (Target ID 97732, PI N. Islam) consisting of 1 ks monitoring observations performed twice a week from 2024-05-27 to 2024-10-10, for a total of 39 observations and an exposure time of 33 ks. The second set is a long-term monitoring campaign (Target ID 16436, PI: P. Romano) consisting of 1 ks observations taken three times a week from 2024-02-18 to 2024-12-04 (MJD 60358–60648), for a total of 98 observations and an exposure time of ∼83 ks. We considered only data collected in photon counting (PC) mode, yielding 137 observations and a total effective exposure time of 114 ks on the target.
We adopt Porb = 4.4006 ± 0.0006 d for the orbital period (Wen et al. 2000; Levine et al. 2004, with phase zero at the minimum of the folded light curve flux, at MJD 50439.919), and Psup = 15.196 ± 0.004 d for the superorbital period (Islam et al. 2023, with phase zero being the time of the maximum of the folded light curve, at MJD 59502.1). Our observations, as reported in Table A.1, cover approximately 66 orbital and 19 superorbital cycles. This is illustrated in Fig. 1, using visualisation techniques previously employed in our previous article on superorbital variability with XRT (Romano et al. 2024).
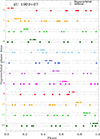 |
Fig. 1. Distribution of observations of 4U 1909+07 as a function of superorbital phase (x-axis) and orbital phase (y-axis). Observations in superorbital phase are represented by grey, empty upward-pointing triangles, and those in orbital phase by grey, empty squares. Filled symbols, shown in different colours for each superorbital phase bin, are offset for clarity. |
The XRT data were processed and analysed uniformly using FTOOLS1 (v6.34), and corresponding calibration (CALDB2) files. We used XSPEC (Arnaud 1996, v12.14.1) for spectral analysis and adopted C-statistics (Cash 1979). We assumed an absorbed power-law model with absorption and photon index as free parameters. The absorption component was modelled with TBABS, using the default Wilms et al. (2000) abundances (ABUND WILM) and Verner et al. (1996) cross-sections (XSECT VERN). Based on the known properties of the source spectral energy distribution in the 0.5–10 keV energy domain (see Sect. 2), this model satisfactorily describes the XRT spectra, with no significant discrepancies identified in the fit residuals that would suggest the need for an additional spectral component and/or the adoption of a different phenomenological spectral model. In this article, errors on the spectral parameters are reported at the 90% confidence level (c.l.). The procedure we adopted for the Swift/XRT data analysis is detailed in Romano et al. (2024) and summarised here.
We first analysed each individual observation. We calculated the orbital and superorbital phase, and from the count rates in the 0.3–4 and 4–10 keV energy bands, we calculated the hardness ratio HR = CR(4–10)/CR(0.3–4. Subsequently, we extracted the average spectrum and fitted it with an absorbed power law to measure the observed 0.3–10 keV flux (Col. 8 of Table A.1).
Second, we performed phase-resolved spectroscopy on the entire campaign using 12 orbital and superorbital phase bins, with 12 chosen as a compromise between achieving a sufficiently high signal-to-noise ratio to accurately determine both the absorption column density and the power-law slope, and having enough points to follow possible variations along the cycles (see also the discussion in our previous articles, Ferrigno et al. 2022; Romano et al. 2024). As a result, our bins contain on average ≈2400 cts bin−1. We calculated the HR in those bins, as shown in the top panel of Fig. 2. We then created an average spectrum in each phase bin and, by adopting an absorbed power-law model, fitted it in the 0.3–10 keV energy range. Our results are summarised in Table 1 and plotted in Fig. 2 (left for the orbital case, right for the superorbital case).
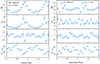 |
Fig. 2. Left: Swift/XRT hardness ratio of 4U 1909+07 and best-fit parameters as a function of orbital phase (Porb = 4.4006 ± 0.0006 d, T0 = MJD 50439.919). The absorption column density NH is in units of 1022 cm−2, the power-law photon index is Γ, and the observed 0.3–10 keV flux is in units of 10−11 erg cm−2 s−1). Right: Same as left, but for the superorbital phase (Psup = 15.196 ± 0.004 d, T0 = MJD 59502.1). |
Orbital and superorbital phase-resolved spectral analysis.
We note that since the source pulse period is approximately 605 s, which is shorter than the typical XRT exposure, any spectral energy variability due to energy-dependent pulsations from the source is averaged out in the stacked XRT spectra and does not affect the results of the orbital and superorbital spectral variability investigations discussed here. The validity of this procedure was extensively discussed in our previous article focussing on the wind-fed X-ray binary 2S 0114+650 (Romano et al. 2024), and was also and verified with the XRT online analysis tool (Evans et al. 2009).
3.2. Swift/BAT
The Swift/BAT Transient Monitor3 (Krimm et al. 2013) has been providing monitoring of more than a thousand sources, including high-mass X-ray binaries, in the 15–50 keV energy band for over 20 years. To investigate the behaviour and potential modulation of the orbital and superorbital periods of 4U 1909+07, we used light curves from the BAT Transient Monitor4 binned at the Swift-orbit level from MJD 53416 to MJD 60670, and thus including the time period of the XRT observational campaign of 4U 1909+07. The light curves were further screened to exclude bad quality points and to only those for which the data-quality flag ‘DATA_FLAG’ was set to 0. A small number of data points with very low fluxes and unrealistically small uncertainties were also removed from the light curves. The times were corrected to the solar system barycentre using astropy time package5. We constructed a dynamic power spectrum, using the technique described in Islam et al. (2023). The power spectrum was calculated using 750-day intervals, each successively shifted in time by 50 days relative to each other, applying the semi-weighting technique, in which both the error bar on each data point and the excess variability in the light curve were considered (Corbet & Krimm 2013; Corbet et al. 2007).
Our results are shown in the top panel of Fig. 3, which exhibits peaks at the orbital period of 4.4 d, the superorbital periods at the fundamental frequency of 15.196 d, and its second harmonic at 7.598 d. The lower panel of Fig. 3 shows the relative strengths of the orbital modulation, the fundamental, and the second harmonic of the superorbital modulations. The right panel displays the power spectrum with peaks corresponding to the orbital and fundamental frequencies and the second harmonic of the superorbital modulations. As seen in Fig. 3, both the fundamental frequency and the second harmonic of the superorbital modulations are present from MJD 53416 to MJD 55500, whereas either the fundamental period or the second harmonic is present from MJD 55500 to MJD 59000, similarly to the results reported in Islam et al. (2023). From MJD 59500 onwards, both the fundamental period and the second harmonic weakened and became consistent with the mean power. The vertical dashed lines in the plot indicate the time period of the XRT campaign discussed in this article. During the XRT campaign, the superorbital modulations at both the fundamental period and the second harmonic weakened. After MJD 60000, near the end of the dynamic power spectrum, several spurious peaks appear in the dynamic power spectrum, with low statistical significance. This is likely due to aliasing effect arising at the end of the last sliding window used to construct the dynamic power spectrum.
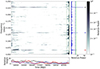 |
Fig. 3. Swift/BAT (15–50 keV) dynamic power spectrum (DPS) analysis of 4U 1909+07 over the entire observation period (MJD 53416–60670). Left panel: DPS in the frequency range 0.05–0.25 d−1. The vertical dotted lines indicate the time range of the XRT campaign discussed in this article. Right panel: Orbital period (4.4 d, indicated by the black arrow), the superorbital period of 15.196 d (red arrow, ∼0.06 d−1), and its second harmonic (blue arrow). The 99.9% and 99.99% significance levels for white noise are shown by the dashed blue and green lines, respectively. Lower panel: Relative strengths of the orbital period (black), superorbital period (red), and its second harmonic (blue). |
4. Results and discussion
In this article, we report on a 10-month observational campaign conducted on 4U 1909+07 with Swift/XRT to investigate spectral variability along its orbital and superorbital periodicities. A visual summary of the results of the XRT data is shown in Fig. 2 (left: orbital, right: superorbital). By comparing the left panel of this figure with Figs. 6 and 8 from Levine et al. (2004), we see that the XRT observations effectively reveal variability in the source power-law slope and absorption column density along the orbit, similar to that previously identified with RXTE/PCA (although this instrument, unlike XRT, did not provide data coverage at energies 0.5–2 keV).
The modulated flux shows a dip around phase 1, a power-law slope that remains virtually constant across all phases, and an absorption column density that substantially increases in correspondence with the flux dip. Levine et al. (2004) satisfactorily explained this dip as being due to the passage of the neutron star behind the companion, providing constraints on the binary parameters (masses of the primary and secondary star, as well as inclination, eccentricity, mass loss rate, and semi-major axis) based on the lack of a full eclipse. The XRT data allowed us to constrain the absorption column density at a level of a few percent as a function of orbital phase and confirm the lack of any significant variability in the slope of the continuum emission (within the recorded uncertainties of ±20–30% on the Γ parameter).
The right panel of Fig. 2 shows, for the first time, the soft X-ray light curve of 4U 1909+07 folded on the superorbital period. In contrast to the orbital plot on the left, there appears to be no significant variability in the spectral properties of the source at the different superorbital phases. The XRT data show that both the power-law photon index and the absorption column density remain virtually constant across all phases, with only the X-ray flux showing noticeable variations. These appear to be rather stochastic, with no obviously recognisable pattern suggesting a specific dependence of the flux on the superorbital phases. It is informative to compare this figure with Fig. 3 of Islam et al. (2023), which shows the variability of the source luminosity at different superorbital phases measured with Swift/BAT in the hard X-ray domain (15–50 keV; we used the same value of the source orbital period and reference epoch to fold the XRT light curve for ease of comparison comparison). The folded BAT light curve displays a smoother variability with an apparent (but barely significant) sinusoidal-like modulation only during intervals when the fundamental frequency of the superorbital modulation is much stronger than the second harmonic and both of them are detected in the dynamic power spectrum (e.g. during the time interval MJD 53416–55500). During intervals when the second harmonic is detected with higher power than the fundamental, or when both frequencies are either marginally or not detected at all, the fractional root mean square (RMS) amplitude of the superorbital intensity profiles increases and the folded BAT light curve exhibits more stochastic behaviour. Figure 3 shows that the BAT data accumulated during the period corresponding to the XRT campaign (MJD 60358–60649) are characterised by aliasing effects due to the end of the last sliding window, as well as increasing background noise in the recent BAT data, and neither the fundamental nor the second harmonic of the superorbital modulation is clearly detected. In this context, it is likely that the stochastic behaviour of the folded XRT light curve can be ascribed to the lack of a sufficiently strong superorbital modulation, which can explain the lack of any significant phase-dependent variation in the source absorption column density and photon index (see Fig. 2, right).
The strong suppression of superorbital modulation across different time intervals of a wind-fed binary remains largely unexplored and poorly understood (see discussion in Islam et al. 2023). In the context of the CIR model, it is possible to ascribe the strong suppression of the modulation to substantial changes in the properties of the CIRs surrounding the massive star, which might change or completely dissolve over time (to be eventually reformed at a later stage; see also Koenigsberger et al. 2006; Coley et al. 2019; Islam et al. 2023, for a discussion about the possible relevance of the tidal oscillation model). To the best of our knowledge, it cannot be completely ruled out that a CIR can evolve on timescales of years, potentially affecting the intensity variations in a wind-fed binary, according to the CIR model for the superorbital modulation. As discussed in Bozzo et al. (2017), the formation and evolution over long timescales (∼years) of the CIRs is an area that remains underdeveloped, primarily due to the lack of observational data in the UV domain following the decommissioning of the International Ultraviolet Explorer (IUE, Faelker et al. 1987) satellite in 1996. Data from the IUE satellite have been the primary (and only) source for discovery and characterisation of the so-called discrete absorption features (DACs) in the spectra of supergiant stars, which ultimately led to the formulation of the CIR theory (see, e.g., Driessen et al. 2023, for a recent review).
Another consideration is that CIRs might not need to be completely dissolved into the surrounding wind for the superorbital modulation of X-ray emission in supergiant wind-fed X-ray binaries to become undetectable. More modest changes in the velocity and density contrasts of CIRs relative to the surrounding stellar wind might simply have decreased below the level required for us to detect the induced variability in the intensity and spectral energy distribution. If the CIRs are only mildly over-dense and moderately slower or faster than the surrounding wind, then the increase in the mass accretion rate occurring when the compact object crosses one of these structures, together with possible changes in the local absorption column density, could only be limited in amplitude and well hidden within the uncertainties of the XRT measurements (up to 20–30% on both the NH and Γ parameters, as shown in Fig. 2).
Acknowledgments
We acknowledge unwavering support from Heidi. This research was funded by the “Programma di Ricerca Fondamentale INAF 2023”. This work has been partially supported by the ASI-INAF program I/004/11/5. NI acknowledges the NASA grant 80NSSC25K7622. This work was supported in part by NASA under award number 80GSFC24M0006. The data underlying this article are publicly available from the Swift archive. This work made use of data supplied by the UK Swift Science Data Centre at the University of Leicester. Happy 20th, Swift.
References
- Arnaud, K. A. 1996, in Astronomical Data Analysis Software and Systems V, eds. G. H. Jacoby, & J. Barnes, ASP Conf. Ser., 101, 17 [NASA ADS] [Google Scholar]
- Barthelmy, S. D., Barbier, L. M., Cummings, J. R., et al. 2005, Space Sci. Rev., 120, 143 [Google Scholar]
- Bozzo, E., Oskinova, L., Lobel, A., & Hamann, W. R. 2017, A&A, 606, L10 [NASA ADS] [CrossRef] [EDP Sciences] [Google Scholar]
- Burrows, D. N., Hill, J. E., Nousek, J. A., et al. 2005, Space Sci. Rev., 120, 165 [Google Scholar]
- Cash, W. 1979, ApJ, 228, 939 [Google Scholar]
- Coley, J. B., Corbet, R. H. D., Fürst, F., et al. 2019, ApJ, 879, 34 [NASA ADS] [CrossRef] [Google Scholar]
- Coley, J., Ballhausen, R., Brumback, M., et al. 2025, Am. Astron. Soc. Meeting Abstr., 245, 341.02 [Google Scholar]
- Corbet, R. H. D., & Krimm, H. A. 2013, ApJ, 778, 45 [NASA ADS] [CrossRef] [Google Scholar]
- Corbet, R., Markwardt, C., Barbier, L., et al. 2007, Prog. Theor. Phys. Suppl., 169, 200 [Google Scholar]
- Corbet, R. H. D., Coley, J. B., Krimm, H. A., Pottschmidt, K., & Roche, P. 2021, ApJ, 906, 13 [Google Scholar]
- Driessen, F. A., & Kee, N. D. 2023, in Winds of Stars and Exoplanets, eds. A. A. Vidotto, L. Fossati, & J. S. Vink, IAU Symp., 370, 161 [Google Scholar]
- Evans, P. A., Beardmore, A. P., Page, K. L., et al. 2009, MNRAS, 397, 1177 [Google Scholar]
- Faelker, J., Gordon, F., & Sandford, M. C. W. 1987, in Exploring the Universe with the IUE Satellite, eds. Y. Kondo, & W. Wamsteker, Astrophys. Space Sci. Lib., 129, 21 [Google Scholar]
- Ferrigno, C., Bozzo, E., & Romano, P. 2022, A&A, 664, A99 [NASA ADS] [CrossRef] [EDP Sciences] [Google Scholar]
- Fürst, F., Kreykenbohm, I., Suchy, S., et al. 2011, A&A, 525, A73 [NASA ADS] [CrossRef] [EDP Sciences] [Google Scholar]
- Fürst, F., Pottschmidt, K., Kreykenbohm, I., et al. 2012, A&A, 547, A2 [NASA ADS] [CrossRef] [EDP Sciences] [Google Scholar]
- Gehrels, N., Chincarini, G., Giommi, P., et al. 2004, ApJ, 611, 1005 [Google Scholar]
- Heyl, J., Doroshenko, V., González-Caniulef, D., et al. 2024, Nat. Astron., 8, 1047 [NASA ADS] [CrossRef] [Google Scholar]
- Islam, N., Corbet, R. H. D., Coley, J. B., Pottschmidt, K., & Fuerst, F. 2023, ApJ, 948, 45 [NASA ADS] [CrossRef] [Google Scholar]
- Jaisawal, G. K., Naik, S., & Paul, B. 2013, ApJ, 779, 54 [Google Scholar]
- Jaisawal, G. K., Naik, S., Ho, W. C. G., et al. 2020, MNRAS, 498, 4830 [NASA ADS] [CrossRef] [Google Scholar]
- Koenigsberger, G., Georgiev, L., Moreno, E., et al. 2006, A&A, 458, 513 [NASA ADS] [CrossRef] [EDP Sciences] [Google Scholar]
- Kretschmar, P., Fürst, F., Sidoli, L., et al. 2019, New Astron. Rev., 86, 101546 [Google Scholar]
- Krimm, H. A., Holland, S. T., Corbet, R. H. D., et al. 2013, ApJS, 209, 14 [NASA ADS] [CrossRef] [Google Scholar]
- Levine, A. M., Rappaport, S., Remillard, R., & Savcheva, A. 2004, ApJ, 617, 1284 [NASA ADS] [CrossRef] [Google Scholar]
- Lobel, A., & Blomme, R. 2008, ApJ, 678, 408 [NASA ADS] [CrossRef] [Google Scholar]
- Martínez-Núñez, S., Sander, A., Gímenez-García, A., et al. 2015, A&A, 578, A107 [NASA ADS] [CrossRef] [EDP Sciences] [Google Scholar]
- Martínez-Núñez, S., Kretschmar, P., Bozzo, E., et al. 2017, Space Sci. Rev., 212, 59 [Google Scholar]
- Romano, P., Bozzo, E., Islam, N., & Corbet, R. H. D. 2024, MNRAS, 527, 10993 [Google Scholar]
- Verner, D. A., Ferland, G. J., Korista, K. T., & Yakovlev, D. G. 1996, ApJ, 465, 487 [Google Scholar]
- Wen, L., Remillard, R. A., & Bradt, H. V. 2000, ApJ, 532, 1119 [Google Scholar]
- Wilms, J., Allen, A., & McCray, R. 2000, ApJ, 542, 914 [Google Scholar]
Appendix A: Supplementary tables
Observation log for 4U 1909+07: ObsID, date (MJD of the middle of the observation), orbital phase, superorbital phase, start and end times (UTC), XRT exposure time, and 0.3–10 keV observed flux.
All Tables
Observation log for 4U 1909+07: ObsID, date (MJD of the middle of the observation), orbital phase, superorbital phase, start and end times (UTC), XRT exposure time, and 0.3–10 keV observed flux.
All Figures
|
Fig. 1. Distribution of observations of 4U 1909+07 as a function of superorbital phase (x-axis) and orbital phase (y-axis). Observations in superorbital phase are represented by grey, empty upward-pointing triangles, and those in orbital phase by grey, empty squares. Filled symbols, shown in different colours for each superorbital phase bin, are offset for clarity. |
| In the text | |
|
Fig. 2. Left: Swift/XRT hardness ratio of 4U 1909+07 and best-fit parameters as a function of orbital phase (Porb = 4.4006 ± 0.0006 d, T0 = MJD 50439.919). The absorption column density NH is in units of 1022 cm−2, the power-law photon index is Γ, and the observed 0.3–10 keV flux is in units of 10−11 erg cm−2 s−1). Right: Same as left, but for the superorbital phase (Psup = 15.196 ± 0.004 d, T0 = MJD 59502.1). |
| In the text | |
|
Fig. 3. Swift/BAT (15–50 keV) dynamic power spectrum (DPS) analysis of 4U 1909+07 over the entire observation period (MJD 53416–60670). Left panel: DPS in the frequency range 0.05–0.25 d−1. The vertical dotted lines indicate the time range of the XRT campaign discussed in this article. Right panel: Orbital period (4.4 d, indicated by the black arrow), the superorbital period of 15.196 d (red arrow, ∼0.06 d−1), and its second harmonic (blue arrow). The 99.9% and 99.99% significance levels for white noise are shown by the dashed blue and green lines, respectively. Lower panel: Relative strengths of the orbital period (black), superorbital period (red), and its second harmonic (blue). |
| In the text | |
Current usage metrics show cumulative count of Article Views (full-text article views including HTML views, PDF and ePub downloads, according to the available data) and Abstracts Views on Vision4Press platform.
Data correspond to usage on the plateform after 2015. The current usage metrics is available 48-96 hours after online publication and is updated daily on week days.
Initial download of the metrics may take a while.