Fig. 3.
Download original image
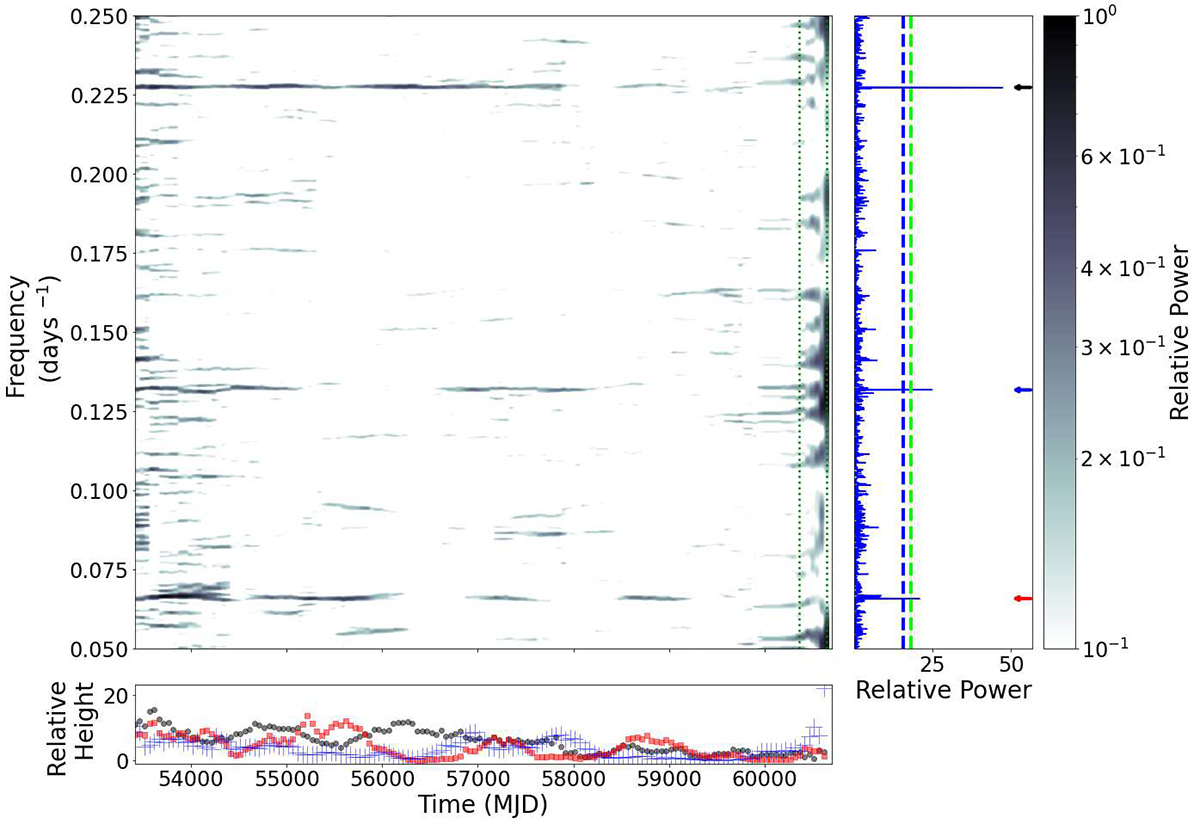
Swift/BAT (15–50 keV) dynamic power spectrum (DPS) analysis of 4U 1909+07 over the entire observation period (MJD 53416–60670). Left panel: DPS in the frequency range 0.05–0.25 d−1. The vertical dotted lines indicate the time range of the XRT campaign discussed in this article. Right panel: Orbital period (4.4 d, indicated by the black arrow), the superorbital period of 15.196 d (red arrow, ∼0.06 d−1), and its second harmonic (blue arrow). The 99.9% and 99.99% significance levels for white noise are shown by the dashed blue and green lines, respectively. Lower panel: Relative strengths of the orbital period (black), superorbital period (red), and its second harmonic (blue).
Current usage metrics show cumulative count of Article Views (full-text article views including HTML views, PDF and ePub downloads, according to the available data) and Abstracts Views on Vision4Press platform.
Data correspond to usage on the plateform after 2015. The current usage metrics is available 48-96 hours after online publication and is updated daily on week days.
Initial download of the metrics may take a while.