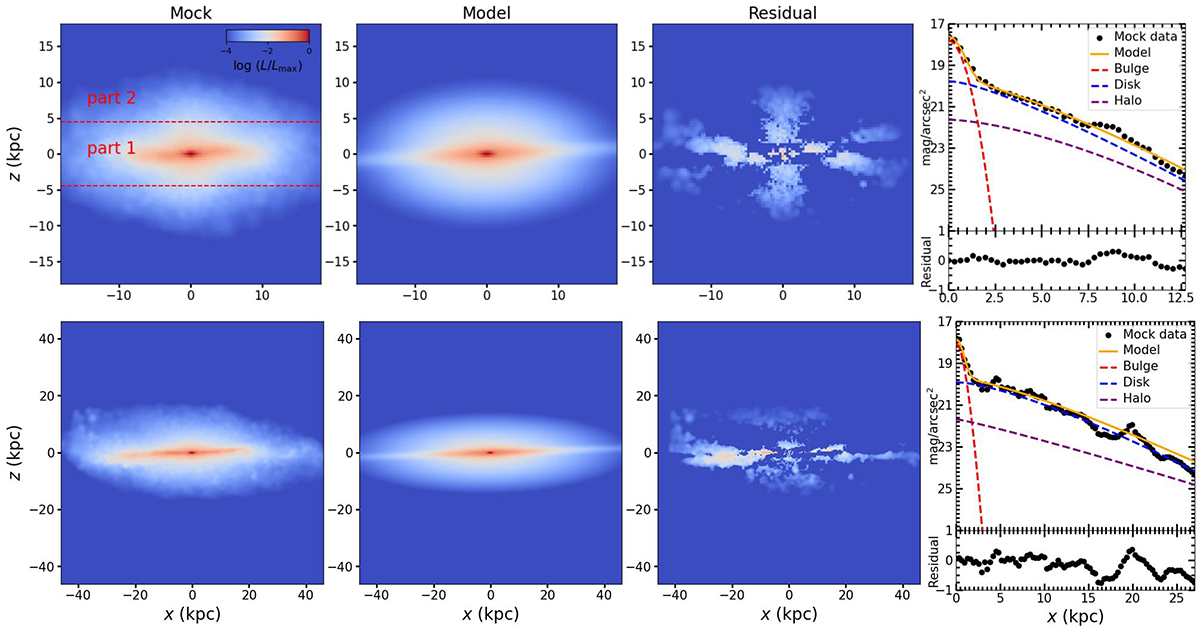
Fig. 5.
Download original image
Examples of photometric decomposition for galaxies in the edge-on view (ID = 513105, 455292). The first column shows the edge-on mock image generated using the GALAXEV pipeline. The dashed red line, located 1Re from the galaxy center, divides the edge-on galaxy into part 1 and part 2. The second column presents the three-component (bulge+disk+stellar halo) model fit by GALFIT. The third column displays the residual of this fitting result. The fourth column shows the one-dimensional surface brightness of different components along the major axis that is oriented to be aligned with the x axis.
Current usage metrics show cumulative count of Article Views (full-text article views including HTML views, PDF and ePub downloads, according to the available data) and Abstracts Views on Vision4Press platform.
Data correspond to usage on the plateform after 2015. The current usage metrics is available 48-96 hours after online publication and is updated daily on week days.
Initial download of the metrics may take a while.