| Issue |
A&A
Volume 689, September 2024
|
|
|---|---|---|
| Article Number | A293 | |
| Number of page(s) | 11 | |
| Section | Extragalactic astronomy | |
| DOI | https://doi.org/10.1051/0004-6361/202450397 | |
| Published online | 20 September 2024 | |
Evolutionary pathways of disk galaxies with different sizes
1
Department of Astronomy, Xiamen University, Xiamen, Fujian 361005, China
2
Kavli Institute for Astronomy and Astrophysics, Peking University, Beijing 100871, China
3
Department of Astronomy, School of Physics, Peking University, Beijing 100871, China
4
Key Laboratory for Computational Astrophysics, National Astronomical Observatories, Chinese Academy of Sciences, Beijing 100101, China
Received:
16
April
2024
Accepted:
1
July
2024
Abstract
Aims. This work delves into the complex interaction between disk galaxies and their host dark matter halos. It specifically focuses on scenarios with minimal external (“nurture”) influences such as mergers and substantial tidal interactions. The study uncovers the varied evolutionary paths of disk galaxies of different sizes, shaped by the initial conditions of their parent dark matter halos and subsequent internal processes. Thus, we can explore the “nature” of these galaxies.
Methods. From the TNG50 simulation, a sample of 836 central disk galaxies with tiny stellar halos is chosen to study the inherent evolution of galaxies driven by nature. These galaxies are classified as compact, normal, or extended by referencing their locations on the mass-size (M⋆ − R½) diagram. Scaling relations were then established to measure the correlations driven by internal mechanisms.
Results. This research demonstrates the distinctive evolutionary pathways of galaxies with different sizes in IllustrisTNG simulations, primarily driven by their nature. It is confirmed that disk galaxies inherit the angular momentum of their parent dark matter halos. More compact galaxies form earlier within halos that exhibit a lower specific angular momentum through heightened star formation during the early phase at redshifts above 2. During the later phase, the size of extended galaxies experiences more pronounced growth by accreting gas with a high angular momentum. Additionally, we reveal that many key characteristics of galaxies are linked to their mass and size: (1) compact galaxies tend to exhibit higher metal content, proportional to the potential well, M⋆/R½; (2) compact galaxies host more massive bulges and black holes, along with a higher central concentration. Furthermore, our analysis indicates that galaxies of all types continue to actively engage in star formation, with no evident signs of quenching attributed to their varying sizes and angular momenta.
Key words: galaxies: evolution / galaxies: fundamental parameters / galaxies: halos / galaxies: spiral / galaxies: star formation / galaxies: structure
Min Du and Hong-Chuan Ma have equal contributions to this work.
Corresponding author: This email address is being protected from spambots. You need JavaScript enabled to view it. .
© The Authors 2024
 Open Access article, published by EDP Sciences, under the terms of the Creative Commons Attribution License (https://creativecommons.org/licenses/by/4.0), which permits unrestricted use, distribution, and reproduction in any medium, provided the original work is properly cited.
This article is published in open access under the Subscribe to Open model. This email address is being protected from spambots. You need JavaScript enabled to view it. to support open access publication.
1. Introduction
It is essential to comprehend the physical reasons behind the size of galaxies to grasp the processes of galaxy formation and evolution. Galaxies span a broad range of sizes in both observational and simulation results, with effective radii or half-mass radii ranging from 0.1 kpc to 10 kpc (e.g., Shen et al. 2003; Bernardi et al. 2010; Lange et al. 2015; Pillepich et al. 2019). In the standard picture of galaxy formation, galaxies acquire their angular momenta from the dark matter halos they reside in, which originate from the cosmological tidal torque field (Hoyle 1951; Peebles 1969; Doroshkevich 1970; White 1984). This analytical model has been extensively applied to forecast the angular momentum and size of galaxies, assuming the angular momentum remains conserved during the formation of galaxies that exhibit a roughly exponential surface density distribution along their radius, maintaining centrifugal equilibrium (Fall & Efstathiou 1980; Dalcanton et al. 1997; Mo et al. 1998; Dutton et al. 2007; Somerville et al. 2008; Guo et al. 2011; Benson 2012). However, this picture is still subject to active debate. Various factors could potentially influence the size of galaxies, such as the conservation efficiency of angular momentum (Danovich et al. 2015), mass fraction of spheroidal structures, alteration of the exponential surface density profile as a result of stellar migration in disks (e.g., Debattista et al. 2006; Roškar et al. 2012; Berrier & Sellwood 2015), faster collapse of material with low angular momentum, the so-called biased collapse (Shi et al. 2017; Posti et al. 2018a), stellar and active galactic nucleus (AGN) feedback (Somerville & Davé 2015; Naab & Ostriker 2017), and even the different physical origins of the exponential surface density (Yoshii & Sommer-Larsen 1989; Ferguson & Clarke 2001; Elmegreen & Struck 2013; Wang et al. 2022).
There is evidence suggesting that the size of galaxies is largely determined by their parent dark matter halos, although some studies found weak/no correlation. Zavala et al. (2016) and Lagos et al. (2017) found a notable connection between the specific angular momentum, j ≡ J/M, the evolution of dark matter, and the baryonic components of galaxies in EAGLE simulations. Grand et al. (2017) showed that galaxy sizes correlate with the spin parameter of dark matter halos using 30 galaxies from the Auriga zoom-in simulations. A consistent result is obtained in IllustrisTNG (e.g., Rodriguez-Gomez et al. 2022; Yang et al. 2023). Cadiou et al. (2022) suggested that the stellar angular momentum and size of galaxies can be affected by their cosmological initial conditions by examining three zoom-in simulations. Desmond et al. (2017) found a weak correlation between galaxy size and the host halo spin parameter in the EAGLE simulation. Zanisi et al. (2020) argued that the scatter in the galaxy-halo size relation for late-type galaxies could be explained by the scatter in stellar angular momentum rather than the halo spin parameter. Varela-Lavin et al. (2023) reported a correlation between asymmetry and spin using the IllutrisTNG(TNG)-50 simulations. Jiang et al. (2019) and Liang et al. (2024) suggested that the central concentration of dark matter halos may also affect the size of galaxies.
Recently, Du et al. (2022, 2024) presented a clear picture about the correlations of stellar mass M⋆, size, and specific angular momentum of stars, j⋆, using disk galaxies in the TNG simulations (Marinacci et al. 2018; Nelson et al. 2018, 2019a; Naiman et al. 2018; Pillepich et al. 2018, 2019; Springel et al. 2018). Du et al. (2022) showed that the j⋆ ∝ M⋆0.55 relation in TNG is consistent with observations (Fall & Efstathiou 1980; Romanowsky & Fall 2012; Posti et al. 2018b; Di Teodoro et al. 2021; Mancera Piña et al. 2021; Hardwick et al. 2022; Rodriguez-Gomez et al. 2022). Du et al. (2022) further showed that the formation of disk galaxies in the TNG simulations is aligned with the framework proposed by Mo et al. (1998). It suggested that galaxies indeed inherit the angular momentum of their parent dark matter halos, but adjustments that are possibly due to baryonic processes are non-negligible. The biased collapse does not have a distinct impact in the Local Universe. Du et al. (2024) further confirmed the existence of a strong relationship between j⋆ − M⋆ and galaxy size in TNG galaxies that are shaped by both initial conditions and internal processes, namely, their “nature”. The intrinsic variation in j⋆ accounts for the mass-size relationship and its significant variability. This finding emphasizes the primary influence of nature on shaping the overall j⋆ − M⋆ and mass-size relations in disk galaxies. Other effects are known to play a relatively minor role. A detailed discussion on the “nature-nurture” dichotomy is provided in Du et al. (2021, in particular, cartoon Fig. 26).
The different sizes of galaxies possibly lead to distinct evolution processes. In the study by Du et al. (2021), it was demonstrated that galaxies dominated by bulges and disks, with minimal external influences, evolve along separate paths (see their Fig. 16). Bulge-dominated galaxies follow a compact pathway that consists of two phases: first, a compact phase where mass increases significantly while size remains relatively constant, leading to the formation of bulges; and second, a phase where size increases considerably while mass growth is relatively limited, resulting in the development of disk-like structures. On the other hand, disk-dominated galaxies gradually form disk-like structures in a more prolonged manner. Therefore, there is a clear connection between the size of galaxies and the recycling of gas in the circumgalactic region, as well as their star formation history. This relationship may further influence the evolution of galaxies in many aspects, for instance, the metal enrichment and the growth of central supermassive black holes (Sánchez-Menguiano et al. 2024; Vaughan et al. 2022; Barone et al. 2020, 2018; D’Eugenio et al. 2018; Krajnović et al. 2018; Grand et al. 2017; Chang et al. 2017). Therefore, it is crucial to comprehend the underlying physical reasons behind the mass-size relationship and what role it plays in the subsequent formation and evolution of galaxies.
In this study, we investigate the evolutionary paths of galaxies with different sizes in the TNG simulations. We select galaxies that have been minimally impacted by external processes (e.g., mergers). In practice, we define these as galaxies that have a small fraction of their stellar mass residing in their halo component, which Du et al. (2021) showed could serve as a robust tracer of the merger history of the galaxy. We analyze how a galaxy’s mass and size influence its other characteristics through internal processes, which represent the natural progression of evolution in Du et al. (2021). We provide a brief introduction of the simulation and the selection criteria of galaxy samples in Sect. 2. The two-phase evolution history of galaxies is illustrated in Sect. 3. Section 4 provides a detailed analysis of the relationship between scatters in the mass-size relation and other galaxy properties. In Sect. 5, we summarize the results.
2. Simulation and sample selection
2.1. The IllustrisTNG project
The TNG suite of gravo-magnetohydrodynamical simulations run with the moving-mesh code AREPO (Springel 2010) follows the standard ΛCDM model with parameters based on the results of Planck Collaboration XIII (2016): Ωm = 0.3089, ΩΛ = 0.6911, Ωb = 0.0486, h = 0.6774, σ8 = 0.8159, ns = 0.9667. The TNG project is the successor of the original Illustris simulation (Vogelsberger et al. 2014; Genel et al. 2014; Nelson et al. 2015; Sijacki et al. 2015), featuring an updated galaxy formation model, such as physical model improvements (e.g., black hole low-state feedback is changed from “radio” bubbles to black hole-driven wind), along with a numerical optimization and treatment of cosmic magnetism (Weinberger et al. 2017; Pillepich et al. 2018; Nelson et al. 2019a). It is composed of three fiducial runs, namely: TNG50-1, TNG100-1, and TNG300-1, which use different simulation boxes and resolutions.
In this work, we use the TNG50-1 (hereafter TNG50) simulation (Nelson et al. 2019a, 2019b; Pillepich et al. 2019). It includes 21603 baryonic elements and 21603 dark matter particles in a periodic box with side length ∼50 comoving Mpc, whose mass resolutions reach 8.41 × 10⁴ M⊙ and 4.57 × 10⁵ M⊙, respectively. The gravitational softening length of both dark matter and stellar particles is 0.29 kpc at z = 0, and the minimum gas softening length reaches 0.074 comoving kpc. Halos and subhalos are identified and characterized using the friends-of-friends (Davis et al. 1985) and SUBFIND algorithms (Springel et al. 2001), respectively. We posit that galaxies are composed of all gas and stars in their host subhalo. Unless otherwise noted, we measured all quantities by using all the particles of galaxies. The progenitors of galaxies are traced back along their main progenitor branches in the merger trees.
2.2. Sample selection and classification of disk galaxies: Compact, normal, and extended
In this study, we aim to examine how galaxies of varying sizes evolve in the case that internal processes dominate. Thus, we selected central galaxies with tiny, kinematically defined stellar halos to minimize the influence of the external processes and environment. The specific selection criteria are outlined below. We used galaxies with stellar masses higher than 109 M⊙ that are able to aptly reproduce the overall kinematic properties of galaxies (Pillepich et al. 2019). Next, we adopted the dynamical decomposition results from Du et al. (2020, 2021)1, which were obtained by employing automatic Gaussian mixture models (auto-GMM) to cluster the circularity, binding energy, and non-azimuthal angular momentum in an accurate, efficient, and unsupervised way (Du et al. 2019). This method separates galaxies into distinct structures: cold disks, warm disks, disky bulges, bulges, and stellar halos. Notably, the stellar particles of stellar halos are primarily characterized by large random motions and weak gravitational binding, primarily induced by external physical processes. Therefore, we select galaxies with tiny stellar halos whose mass fraction is fhalo < 0.2, aiming to minimize the influence of mergers and strong tidal interactions. We have confirmed that nearly all galaxies we selected are disk galaxies characterized by κrot > 0.5. κrot, defined as:
 (1)
(1)
where jz denotes the specific angular momentum along the minor-axis z-axis of each galaxy, R is the projected radius, and K is the total kinetic energy (Sales et al. 2012). A few galaxies with κrot < 0.5 in the sample selected by fhalo < 0.2 were excluded. In the end, 836 galaxies were left.
Figure 1 shows the stellar mass-size relation of the TNG50 galaxy sample chosen at z = 0. Here, the galaxy size corresponds to the half-mass radius measured in the face-on view, R1/2. In general, disk galaxies have a wide range of sizes. We find R1/2 can vary by up to a factor of approximately 10 for galaxies with the same mass in Fig. 1. Du et al. (2024) verified that the size of galaxies largely depends on the angular momentum under the exponential hypothesis using the same sample we selected here. Thus, we classified galaxies into compact, normal, and extended galaxies in this work to investigate the different evolutionary pathways in galaxies with different sizes. It is worth noting that the galaxies we have selected are distributed continuously. The best-fit mass-size relation is obtained from linear regression:
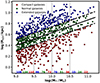 |
Fig. 1. Stellar mass-size relation for the central disk galaxies with tiny stellar halos we selected in the TNG50 simulation at z = 0. A linear fit of the mass-size correlation is represented by the solid black line. We categorize galaxies based on their deviation within ±0.5σ from the linear fit, as the dashed lines indicate. Galaxies falling within the range of −0.5σ to 0.5σ are identified as ‘normal galaxies’ (green dots), those exceeding 0.5σ are labeled as ‘extended galaxies’ (blue dots), and those falling below −0.5σ are designated as ‘compact galaxies’ (red dots). The dotted lines partition the galaxies into four mass bins (M1–M4) encompassing 109 − 9.5 M⊙, 109.5 − 10 M⊙, 1010 − 10.5 M⊙, and 1010.5 − 11.5 M⊙. The bottom of this figure provides the count of galaxies of each type within M1–M4. |
 (2)
(2)
It gives a large scatter σ = 0.21 of log (R1/2/kpc). We then quantified the deviation from the predicted size log R1/2, fit of such a mass-size relation using:
 (3)
(3)
Galaxies with ΔR1/2 > 0.5σ are classified as extended galaxies, while those with ΔR1/2 < −0.5σ are classified as compact galaxies. Galaxies with −0.5σ < ΔR1/2 < 0.5σ fall into the category of normal galaxies. Additionally, we segmented the mass range into four bins, M1: 109 M⊙ < M⋆ < 109.5 M⊙, M2: 109.5 M⊙ < M⋆ < 1010 M⊙, M3: 1010 M⊙ < M⋆ < 1010.5 M⊙, and M4: M⋆ > 1010.5 M⊙, Due to the rarity of galaxies with stellar mass exceeding 1011 M⊙ within our sample, we have included them in the category marked M4. The number of each type of galaxies is provided at the bottom of Fig. 1.
Figure 2 gives examples of a compact (ID 631677), a normal (ID 621707), and an extended (ID 619081) galaxy from our selected sample. The panels show the surface density distributions of face-on projected cold gas and stars at z = 0, 1, 1.5, and 2 (from bottom to top). Here, we take the star-forming gas cells as cold, and the rest as hot. The stellar mass M⋆, cold gas mass Mcold gas, and size R1/2 of each galaxy are displayed at the top left-hand corner. It is clear that the evolution of the galaxies we selected here is dominated by internal processes. Compact galaxies form from a more compact, cold-gas disk.
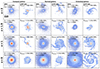 |
Fig. 2. Surface density distributions of stars and cold gas in the face-on view of compact (left), normal (middle), and extended (right) galaxies at z = 0, 1, 1.5, 2. From top to bottom, we show the evolution of stellar and cold gas. Their stellar mass M⋆ and 2D half-mass radius R1/2 are given on the left-hand corner of each panel. |
2.3. Selected galaxies minimally influenced by external processes and AGN feedback quenching
It is well known that the AGN feedback can quench galaxies. Hence, we investigated the black hole masses across galaxies of varying sizes to ascertain the presence of AGN feedback. Figure 3 shows the properties of the sample and variations in properties among different galaxy types at z = 0. Panel a of Fig. 3 shows the M⋆ − MBH relation for compact, normal, and extended galaxies. The right sub-panel shows the histogram of black hole masses, with the majority of galaxies having black hole masses below 108 M⊙. It is lower than the threshold for turning on the radio (kinetic) mode AGN feedback that starts to play an important role in quenching star formation in the TNG simulation (Weinberger et al. 2017, 2018). This suggests that our selected galaxies have not been strongly quenched by AGN feedback.
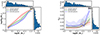 |
Fig. 3. Properties of galaxies in our sample at z = 0. Panel a: Black hole mass as a function of stellar mass for the compact, normal, and extended galaxies. The top and right sub-panels show the histograms computed from all galaxies, respectively. Panel b: Ex situ mass fraction facc as a function of the stellar mass and the histogram distributions. |
We further examined the extent to which the sample selected based on fhalo < 0.2 has managed to avoid the influence of strong interactions and mergers. We adopted the stellar assembly history supplementary catalog provided on the TNG website (Rodriguez-Gomez et al. 2015, 2016, 2017)2. Panel b of Fig. 3 shows the ex-situ stellar mass fraction, facc, as a function of the stellar mass for compact, normal, and extended galaxies. More extended galaxies tend to have a slightly larger facc (Zhu et al. 2023). It is reasonable to assume that ex situ stars are likely to move on orbits with a large radius and ellipticity (e.g., Naab et al. 2009; Dubois et al. 2016). This could then result in the enlargement of galaxies. The right histogram of the panel b shows that facc is generally less than 0.1. The effect of external processes thus is small. Then, fhalo is a convenient measurement to use to eliminate the need to account for variations in the details of external processes. And it is measurable in edge-on galaxies using either kinematic (Yang et al. 2022) or morphological (e.g., Gadotti & Sánchez-Janssen 2012) methods. The sample we selected is able to unveil the innate evolutionary pathway of galaxies primarily depending on their size and mass.
3. The evolutionary pathways of galaxies with different sizes
Du et al. (2022, 2024) verified that the size of galaxies is largely determined by the inherent scatter of the specific angular momentum of their host dark matter halos, jh. These authors used an identical galaxy sample characterized by small kinematic stellar halos with a mass ratio of fhalo < 0.2. Such galaxies aptly explain the observed j⋆ − M⋆ relation and the mass-size relation in the Local Universe. Their results suggested that the scatter of the mass-size relations at z = 0 originates from j⋆. However, the j⋆, M⋆, and R1/2 values of galaxies are the outcomes of a series of highly complex and nonlinear baryonic physical processes. Therefore, understanding the evolution of the mass-size relation and its scatter requires tracing the progression from dark matter halos to gas, then to cold gas, and, finally, to stars. This section aims to uncover the growth history of the size, mass, and specific angular momentum of dark matter halos, gas (including cold gas), and stars, thus elucidating their correlations.
3.1. Early phase formation of galaxies: All galaxies with a similar specific angular momentum and size or compact galaxies with slightly higher masses
In this work, we regard all processes at z > 2 as the early-phase evolution of galaxies and z < 2 as the late-phase evolution. Every profile color-coded by ΔR1/2 shows the evolution of one galaxy in Fig. 4. The shaded areas represent the 1σ boundaries of compact (red), normal (green), and extended (blue) galaxies classified in Sect. 2.2. Subsequent figures will not display individual galaxy profiles. Instead, the 1σ envelopes will be used to emphasize distinctions among galaxy types. In the early phase, there’s no significant difference in the size R1/2 among the three types of galaxies. Furthermore, all galaxies exhibit comparable R1/2 varying roughly from 0.5 kpc to 2 kpc, with a median size of about 1 kpc, as shown in Fig. 4. Recently, Ormerod et al. (2024) reported result that galaxies with stellar mass greater than 109.5 M⊙ observed at z > 3 by JWST have a similar size ∼1 kpc. This result is consistent with the TNG galaxies we selected here, assuming the mass-to-light ratios of galaxies do not vary significantly along the radius.
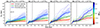 |
Fig. 4. Evolutionary trajectory of the galaxy we have chosen in terms of its half-mass radius, R1/2, growth. Each solid line corresponds to a specific galaxy, color-coded according to ΔR1/2. The bold solid lines and shaded areas indicate the median and the 1σ variation for compact (red), normal (green), and extended (blue) galaxies. The galaxies are categorized into M1–M4 from left to right. Vertical dashed lines are the time at a redshift of z = 2. |
We further show the evolution of mass and angular momentum in Figs. 5 and 6. From top to bottom, we trace the growth history of dark matter, total gas, cold gas, and stars in selected galaxies. In the early phase, compact galaxies have a negligible difference in dark matter and total gas mass compared to normal and extended counterparts (shown in the first and second rows of Fig. 5). However, compact galaxies exhibit slightly more massive stellar components, possibly due to their faster growth via the accretion of more cold gas (shown in the third row of Fig. 5). Notably, dark matter, gas (cold gas), and stars have similar and low specific angular momentum (as shown in Fig. 6). It is clear that the formation of more compact galaxies in the early phase is attributed to the presence of a greater amount of low angular momentum gas, as proposed by Du et al. (2024). Therefore, this finding aligns with the concept of biased collapse (e.g., van den Bosch 1998; Shi et al. 2017), suggesting that gas with a low specific angular momentum cools down more rapidly. The similar sizes of compact, normal, and extended galaxies can be attributed to the maintenance of similar specific angular momentum throughout the process from dark matter halos to galaxies. Consequently, compact galaxies have slightly more cold gas with a low jcold gas value, leading to the formation of somewhat more massive stellar components compared to their more extended counterparts (as shown in the bottom panels of Fig. 5).
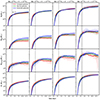 |
Fig. 5. Mass growth history of dark matter halo, gas, cold gas, and stars (from top to bottom) in compact (red), normal (green), and extended (blue) galaxies we selected. The solid profiles and shaded regions represent the median and 1σ envelope. From left to right, the galaxies are organized as M1–M4. |
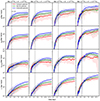 |
Fig. 6. Angular momentum growth history of dark matter halos, gas, cold gas, and stars (from top to bottom) in compact (red), normal (green), and extended (blue) galaxies we selected. The solid profiles and shaded regions represent the median and 1σ envelope. From left to right, the galaxies are organized as M1–M4. |
Overall, all galaxies have similar specific angular momentum (e.g., jh, jgas, jcold gas, and j⋆) and size, but compact galaxies have slightly higher stellar mass. Consequently, the slope of the mass-size relation remains flat at high redshifts. This finding aligns with the mass-size relation of star-forming galaxies derived by Genel et al. (2018) using TNG100 at z = 2. It is important to highlight that the early-phase evolution of galaxies likely determines their bulge growth. By a redshift of z ∼ 2, galaxies have accumulated approximately 10% of their total stellar masses at z = 0. This is likely to contribute to the early formation of bulges due to the accretion of low jcold gas. Hence, it can be concluded that the formation of galaxies with different sizes follows a similar pattern in the early phase and may have a limited impact on determining the overall properties of galaxies.
3.2. Late-phase secular evolution of galaxies: Gradual assembly of extended disks in cases of high angular momentum
In the late phase at z < 2, the discrepancy of size between compact and extended galaxies increases significantly (Fig. 4); meanwhile, the difference in their stellar masses decreases gradually, as shown in the bottom panels of Fig. 5. Extended galaxies form stars slightly faster than compact ones (see more details about the star formation history in Sect. 4.2). Galaxies in different mass ranges follow a similar trend. Surprisingly, the sizes of compact galaxies have a small change over the past 10 Gyr, while extended galaxies have grown significantly larger from median size – going roughly from 1.27 kpc to 4.51 kpc for M1, from 1.43 kpc to 6.45 kpc for M2, from 1.77 kpc to 8.06 kpc for M3, and from 2.20 kpc to 10.31 kpc for M4. At z = 0, the overall difference between compact and extended galaxies is a factor 2.5–3 greater. Thus, the different evolutionary pathways of extended and compact galaxies are consistent with those of disk- and bulge-dominant galaxies used in Du et al. (2021).
Galaxies of various sizes and their consequent evolutionary pathways are largely determined by the difference in jh. The top panels of Figs. 5 and 6 show clearly that the host dark matter halos of compact galaxies have similar Mh, but lower jh by several times, compared to their extended counterparts. Despite what complex baryonic processes may be involved, the difference in specific angular momentum is well maintained, as suggested when comparing jgas, jcold gas, and j⋆. The cold gas and stars of compact galaxies inherit low angular momenta from their parent dark matter halos, which finally determines the size difference of galaxies, leading to compact and extended evolutionary pathways. This result verifies again that, without effects from external processes, the value of jh determines the size R1/2 of disk galaxies, which is consistent with theoretical arguments (e.g., Fall & Efstathiou 1980; Mo et al. 1998) as well as some hydrodynamic cosmological simulations (Grand et al. 2017; Rodriguez-Gomez et al. 2022; Yang et al. 2023; Du et al. 2024). Du et al. (2024) further showed that disk galaxies in TNG50 follow a tight j⋆ − M⋆-size scaling relation when mergers are unimportant. Furthermore, the evolutionary path of jgas and jh exhibit remarkable similarities, which indicates that in the absence of baryonic processes, the growth history of angular momentum will not undergo significant changes. It is worth mentioning that the difference of jcold gas appears about 3 Gyr later than that of jgas. It is reasonable that the gas with high angular momentum cannot spin-up the cold gas reservoir immediately due to the pre-existing cold gas with low jcold gas. Also, j⋆ evolves similarly to jcold gas.
Additionally, the difference between compact and extended galaxies is not only due to the difference of jh but also the difference of baryonic fraction. The second row of Fig. 5 clearly shows that more compact galaxies accrete significantly less gas than extended ones in the late phase, while their dark matter and stellar components are similar. A similar result is obtained by Pérez-Montaño et al. (2022). The Mgas difference in three types of galaxies becomes smaller from M1 to M4. It indicates that galaxies of varying sizes are found in different environments, as also shown in Fig. 7. We see that Mb, env and MDM, env are the mass of baryon and dark matter components of the group or cluster that each selected galaxy belongs to. The cumulative distribution of Mb, env/MDM, env thus represents the proportion of baryonic mass within the environment where the central galaxies originate. At z = 0, the median of Mb, env/MDM, env reaches  around extended galaxies, while compact galaxies are generally located in a relatively low-density environment, with a median of Mb, env/MDM, env = 0.103. It is important to highlight that this deviation is probably attributed to the expansion of dark matter halos in the late phase, as there is no evident distinction at z = 2. The p-value obtained from a Kolmogorov–Smirnov (KS) test comparing compact and extended galaxies at z = 0 and z = 2 are nearly 0 and 0.167, respectively. This result suggests that extended galaxies may originate in environments where galaxies can accrete more gas.
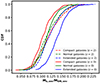 |
Fig. 7. Cumulative distribution of baryonic to dark matter mass ratio of the group or cluster environment that compact (red), normal (green), and extended (blue) galaxies belong to at z = 2 (dash) and z = 0 (solid). |
In this section, we show how the angular momenta of dark matter are transferred to galaxies in TNG simulations, which finally determines the galaxy size, as suggested by Du et al. (2022, 2024). The properties and environment of parent dark matter halos, namely, their nature, play a vital role in the evolutionary history of both compact and extended galaxies. Therefore, the mass-size relation and its scatter are achieved by adjusting the nature of galaxies, including internal physical processes as well as initial jh. Moreover, it is well known that the size and mass of galaxies affect significantly also metallicity, star formation rate (SFR), and black hole mass, which are investigated in the next section.
4. Correlation between the size and other properties of galaxies at z = 0
4.1. More compact galaxies tend to host more massive bulges, but are less influenced by external processes
The compactness and bulge growth in galaxies are primarily influenced by jh. It is thus not surprising that more compact galaxies tend to harbor more massive bulges (Du et al. 2021). Figure 8 shows fbulge measured by kinematic decomposition adopted from Du et al. (2019, 2020) (solid profiles) and the result of 1D Sérsic bulge + exponential disk decomposition in morphology (dashed profiles). It is clear that more compact galaxies with M⋆ > 1010 M⊙ generally tend to host more massive bulges measured by both kinematic and morphological methods. Kinematically derived fbulge values are typically smaller by ∼0.1 than those measured by morphological decomposition. This difference diminishes at lower mass ranges (M⋆ < 1010 M⊙), although the reason is still unclear.
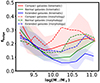 |
Fig. 8. Bulge-to-total mass ratio, fbulge, as a function of the stellar mass of the galaxy sample we selected. The solid and dashed profiles are results measured by kinematic and morphological methods, respectively. The shaded regions represent the 1σ envelope of kinematic fbulge. |
The result above supports the notion that galaxies with a lower initial angular momentum are likely to form more massive bulges. Surprisingly, facc in compact galaxies is smaller than that in more extended cases, as illustrated in the right panel Fig. 3. In other words, compact galaxies have lower facc but larger fbulge than extended ones. This suggests that the limited external influences in compact galaxies with small stellar halos may not effectively facilitate bulge growth, contradicting the common belief that mergers are the primary drivers of bulge formation.
4.2. Star formation rate is reduced but not quenched in compact galaxies
In Fig. 9, SFR is measured by summing the SFR values of all gas cells within each galaxy at each snapshot. Noteworthy fluctuations in SFR have been observed across galaxies of varying sizes. In the early phase, the jcold gas values of the three galaxy types are comparable and predominantly shape the SFR through Mcold gas. However, in the late phase, more extended galaxies generally have higher both jcold gas and Mcold gas. Consequently, compact galaxies exhibit higher stellar masses in the early phase. As the evolution progresses, the SFR of extended galaxies slightly exceeds that of compact ones, resulting in similar stellar masses at z = 0.
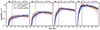 |
Fig. 9. Star formation rate history of compact (red), normal (green), and extended (blue) galaxies we select. The vertical dashed lines mark the time of redshift z = 2. The solid profiles and shaded regions represent the median and 1σ envelopes. From left to right, the galaxies are divided into four mass ranges: M1–M4. |
There is no clear signature of “angular momentum quenching” in nature. In Fig. 10, most galaxies (black dots) in this analysis lie above the dashed line that delineates star-forming and quiescent galaxies (e.g., Lyu et al. 2023; Genel et al. 2018). The median SFR values at z = 0 for compact, normal, and extended galaxies are denoted by red, green, and blue dots with accompanying error bars, respectively. While compact galaxies demonstrate a slightly lower SFR compared to their extended counterparts, the scatter in data points is considerable. The presence of a limited number of quenched galaxies is likely instantaneous or a consequence of AGN feedback stemming from their comparatively more massive black holes. These results suggest that the so-called “angular momentum quenching”, as proposed by Peng & Renzini (2020), lacks a clear manifestation when external influences are not taken into account.
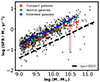 |
Fig. 10. Star formation rate as a function of stellar mass. The colored solid lines represent compact (red), normal (green), and extended (blue) galaxies, respectively. The criterion indicated by the black dashed line, as proposed by Lyu et al. (2023), is used to differentiate between star-forming and quenched galaxies. |
Wang et al. (2022) and Lu et al. (2022) demonstrated that external mechanisms inject angular momentum into the circumgalactic medium, thereby influencing or potentially halting star formation. Consequently, the increase in angular momentum may be one consequence of mergers rather than a direct approach to quench galaxies. In conclusion, our results show that variations in angular momentum obtained by gas accretion from the cosmic web are not enough to quench galaxies, highlighting the necessity to factor in external physical processes.
4.3. Mass-size-X scaling relations: Implications for formation time, metallicity, central concentration, and black hole mass
Both the size and stellar mass of galaxies correlate tightly with the other properties of galaxies. We examine the scaling relations that are determined by the mass and size in Fig. 11. A power-law relationship can be used to describe such scaling relations, as follows:
 (4)
(4)
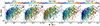 |
Fig. 11. Stellar mass-size relation for the galaxies in the TNG50 simulation at z = 0. From left to right: Data are color-coded by the stellar metallicity (Z⋆), gas metallicity (Zgas), galaxy formation time (tform), black hole mass (MBH), and stellar density measure within central 1 kpc in the cylindrical coordinate (Σ1 (2D)). Diagonal dashed lines represent lines of constant velocity dispersion, calculated using the formula |

where the index α measures the extent to which properties X are correlated with both M⋆ and R1/2. It is evident that the metallicity in both gas and stars shows a synchronized decrease on the M⋆–R1/2 diagram. Therefore, we conducted a surface fitting in the three-dimensional (3D) space. The results of the fitting for galaxy formation time (tform), metallicity, and black hole mass are presented in Table 1, offering an empirical M⋆–R1/2–X relationship derived from the nature of galaxies in TNG simulations.
Best-fit parameters for the mass-size-X scaling relations of central disk galaxies in TNG.
4.3.1. Metallicity
We investigate how the stellar and gas metallicity of galaxies are related to their mass and size in our sample, as shown in the first and second panels of Fig. 11. Our analysis reveals that galaxies with smaller sizes R1/2 tend to have higher metallicity when they have the same mass. Similarly, galaxies with the same size R1/2 exhibit higher metallicity as their mass increases, in line with the results of Vaughan et al. (2022). Hence, the metallicity of a galaxy is not only linked to its mass but also to its size. This observation aligns with previous findings and theoretical predictions (Barone et al. 2018, 2020; D’Eugenio et al. 2018), which indicate a stronger correlation between the metallicity of stars Z⋆ = Mstar, Z/Mstar, total and gas Zgas = Mgas, Z/Mgas, total with the masses and sizes of galaxies (rather than just their masses).
The underlying physical mechanisms driving this relationship are not yet fully understood. It is commonly thought to be connected to the gravitational potential well of the galaxy, as galaxies with deeper potential wells can retain more metal-rich gas due to their higher escape velocities (Franx & Illingworth 1990; Emsellem et al. 1996; Scott et al. 2009, 2017). The fitting parameter α for the metallicity of stars and gas, as shown in Table 1, is approximately 1. The relationship  suggests that gravitational potential or velocity dispersion can be used to predict the metallicity of galaxies, which is consistent with previous studies’ findings (Barone et al. 2018, 2020, 2022; Vaughan et al. 2022). This result further suggests that the dark matter halo may influence the metal enrichment of disk galaxies by determining their sizes and stellar masses.
4.3.2. Galaxy formation time, the growth of central concentration, and super-massive black holes (SMBHs)
Compact galaxies form earlier than their extended counterparts, as indicated in Sect. 3.1. The galaxy formation time tform is the time when the stellar mass M⋆ reaches half its value at z = 0. The mass-size relation color-coded by tform is shown in the third panel of Fig. 11, clearly illustrating that compact galaxies form earlier. This relationship can also be well described by Eq. (4). The fitting results give log tform ≃ −0.113 log[M⋆/(R1/2)1.638]+1.873 (Table 1).
Moreover, more compact galaxies tend to form earlier and grow more massive bulges, as demonstrated in Sect. 4.1. The inflow of cold gas into the galaxy’s center potentially also promotes the fast growth of the central concentration and the black hole’s mass (Grand et al. 2017; Genel et al. 2018; Rodriguez-Gomez et al. 2022). It’s not surprising that compact galaxies tend to harbor more massive black holes, partly because more gas can reach the galaxies’ central regions. Another factor is the impact of AGN feedback on galactic angular momentum, which primarily occurs in later stages, suppressing late-time gas accretion in galaxies with more massive black holes. Since gas accreted late typically has higher specific angular momentum, its absence could explain why galaxies with larger black hole masses exhibit lower j⋆ values (Grand et al. 2017; Rodriguez-Gomez et al. 2022).
The growth of the bulge can also be quantified by central stellar densities measured within 1 kpc from the galactic center in either cylindrical (2D) or polar (3D) coordinate Σ1. In Fig. 11, we can see the mass of central SMBHs follow a similar parallel manner to Σ1. More massive galaxies with smaller sizes tend to have larger central densities as well as larger black hole masses. Empirical correlations are given in Table 1 via fitting the parameters of Eq. (4). The deviation of the MBH scaling relation from observational findings log MBH ∝ log[M⋆/(R1/2)1.073] in Krajnović et al. (2018) is not unexpected, given the significant measurement uncertainties and the possibility of inaccurate subgrid-physics in TNG simulations.
It is worth mentioning that the increase in bulge mass and central concentration Σ1 has been proposed as a mechanism for suppressing star formation in galaxies (e.g., Martig et al. 2009; Fang et al. 2013; Lang et al. 2014). While compact galaxies do exhibit a somewhat lower SFR, it remains uncertain whether the growth of bulges directly leads to SFR suppression in disk galaxies. Alternatively, the decrease in SFR is likely to be linked to the depletion of gas during the evolution of compact galaxies in the late phase.
We do not anticipate that the TNG simulations will accurately reproduce all properties and scaling relations of galaxies that we discuss here. In particular, the resolution of TNG simulations cannot sufficiently resolve the central part of galaxies. However, the TNG simulation can provide a physical vantage point for comprehending the more intricate physical mechanisms derived from the fundamental properties (mass and size) of galaxies in terms of their nature. In future simulations, researchers can examine the alterations in these correlations by modifying the physical models.
5. Summary
In this study, we use the data from the TNG50-1 simulation to categorize central disk galaxies into three typical morphologies: compact, normal, and extended. We thoroughly investigated the growth histories of each galaxy type, focusing on their various components (e.g., dark matter, star, gas). Additionally, we explored the connection between galaxy properties and their masses and sizes driven by their nature, providing insights through an analysis of their growth history. Our primary results can be summarized as follows:
-
In the early phase z > 2, more compact galaxies form earlier, while all galaxies exhibit similar specific angular momentum, j⋆, and size, R1/2, typically around 1 kpc, which is aligned with observational data. Therefore, the slope of the mass-size relation is flat. Additionally, we find that compact galaxies possess a greater amount of cold gas, leading to earlier stellar mass accumulation.
-
In the later phase, there are significant discrepancies in jh between compact and extended galaxies, with no substantial variations in Mh. Despite the involvement of complex baryonic physical mechanisms, galaxies retain the specific angular momentum of their parent dark matter halos, which dictates the rate of growth in size, R1/2. Galaxies with higher j⋆ experience a quicker increase in size, resulting in a steeper slope in the mass-size relationship. The presence of different j⋆ values for the same mass contributes to the dispersion in the mass-size relation.
-
All types of galaxies undergo star formation. There is no clear signature of “angular momentum quenching” in galaxies we selected where no external processes have been considered.
-
More compact galaxies retain more metals, which is consistent with observations and the theoretical prediction that the gravitational potential well determines the metallicity enrichment. It gives an empirical scaling relation, indicating that log Zgas and log Z⋆ are proportional to log(M⋆/R1/2). Additionally, for galaxies of the same size, those with a larger mass had formed earlier and exhibit a higher metallicity.
-
A more compact galaxy generally has faster cold gas accretion into its central regions, which accelerates the mass growth of both the bulge and black holes. We propose an empirical scaling relation, namely, log MBH ≃ 0.936 log[M⋆/(R1/2)0.613]−1.619. Additionally, more compact galaxies also tend to develop a larger bulge and central concentration at a faster rate.
These findings confirm that the characteristics of galaxies are strongly linked to their associated dark matter halos. In situations where external factors are not important, the stellar mass and size of galaxies play a significant role in shaping their various properties.
The data is publicly accessible at https://www.tng-project.org/data/docs/specifications/#sec5m
The data are publicly accessible at https://www.tng-project.org/data/docs/specifications/#sec5g
Acknowledgments
The authors acknowledge the support by the Natural Science Foundation of Xiamen, China (No. 3502Z202372006), the Fundamental Research Funds for the Central Universities (No. 20720230015), and the Science Fund for Creative Research Groups of the National Science Foundation (NSFC) of China (No. 12221003). L.C.H. was supported by the National Science Foundation of China (11991052, 12233001), the National Key R&D Program of China (2022YFF0503401), and the China Manned Space Project (CMS-CSST-2021-A04, CMS-CSST-2021-A06). S.L. acknowledges the support by the NSFC grant (No. 11988101) and the K. C. Wong Education Foundation. The TNG50 simulation used in this work, one of the flagship runs of the IllustrisTNG project, has been run on the HazelHen Cray XC40-system at the High-Performance Computing Center Stuttgart as part of project GCS-ILLU of the Gauss centers for Supercomputing (GCS). This work is also strongly supported by the Computing Center in Xi’an.
References
- Barone, T. M., D’Eugenio, F., Colless, M., et al. 2018, ApJ, 856, 64 [Google Scholar]
- Barone, T. M., D’Eugenio, F., Colless, M., & Scott, N. 2020, ApJ, 898, 62 [NASA ADS] [CrossRef] [Google Scholar]
- Barone, T. M., D’Eugenio, F., Scott, N., et al. 2022, MNRAS, 512, 3828 [NASA ADS] [CrossRef] [Google Scholar]
- Benson, A. J. 2012, New Astron., 17, 175 [NASA ADS] [CrossRef] [Google Scholar]
- Bernardi, M., Shankar, F., Hyde, J. B., et al. 2010, MNRAS, 404, 2087 [NASA ADS] [Google Scholar]
- Berrier, J. C., & Sellwood, J. A. 2015, ApJ, 799, 213 [NASA ADS] [CrossRef] [Google Scholar]
- Cadiou, C., Pontzen, A., & Peiris, H. V. 2022, MNRAS, 517, 3459 [NASA ADS] [CrossRef] [Google Scholar]
- Chang, Y.-Y., Le Floc’h, E., Juneau, S., et al. 2017, MNRAS, 466, L103 [NASA ADS] [CrossRef] [Google Scholar]
- Dalcanton, J. J., Spergel, D. N., & Summers, F. J. 1997, ApJ, 482, 659 [NASA ADS] [CrossRef] [Google Scholar]
- Danovich, M., Dekel, A., Hahn, O., Ceverino, D., & Primack, J. 2015, MNRAS, 449, 2087 [Google Scholar]
- Davis, M., Efstathiou, G., Frenk, C. S., & White, S. D. M. 1985, ApJ, 292, 371 [Google Scholar]
- Debattista, V. P., Mayer, L., Carollo, C. M., et al. 2006, ApJ, 645, 209 [Google Scholar]
- Desmond, H., Mao, Y.-Y., Wechsler, R. H., Crain, R. A., & Schaye, J. 2017, MNRAS, 471, L11 [NASA ADS] [CrossRef] [Google Scholar]
- D’Eugenio, F., Colless, M., Groves, B., Bian, F., & Barone, T. M. 2018, MNRAS, 479, 1807 [CrossRef] [Google Scholar]
- Di Teodoro, E. M., Posti, L., Ogle, P. M., Fall, S. M., & Jarrett, T. 2021, MNRAS, 507, 5820 [NASA ADS] [CrossRef] [Google Scholar]
- Doroshkevich, A. G. 1970, Astrofizika, 6, 581 [Google Scholar]
- Du, M., Ho, L. C., Zhao, D., et al. 2019, ApJ, 884, 129 [NASA ADS] [CrossRef] [Google Scholar]
- Du, M., Ho, L. C., Debattista, V. P., et al. 2020, ApJ, 895, 139 [CrossRef] [Google Scholar]
- Du, M., Ho, L. C., Debattista, V. P., et al. 2021, ApJ, 919, 135 [NASA ADS] [CrossRef] [Google Scholar]
- Du, M., Ho, L. C., Yu, H.-R., & Debattista, V. P. 2022, ApJ, 937, L18 [NASA ADS] [CrossRef] [Google Scholar]
- Du, M., Ma, H.-C., Zhong, W.-Y., et al. 2024, A&A, 686, A168 [NASA ADS] [CrossRef] [EDP Sciences] [Google Scholar]
- Dubois, Y., Peirani, S., Pichon, C., et al. 2016, MNRAS, 463, 3948 [Google Scholar]
- Dutton, A. A., van den Bosch, F. C., Dekel, A., & Courteau, S. 2007, ApJ, 654, 27 [NASA ADS] [CrossRef] [Google Scholar]
- Elmegreen, B. G., & Struck, C. 2013, ApJ, 775, L35 [NASA ADS] [CrossRef] [Google Scholar]
- Emsellem, E., Bacon, R., Monnet, G., & Poulain, P. 1996, A&A, 312, 777 [NASA ADS] [Google Scholar]
- Fall, S. M., & Efstathiou, G. 1980, MNRAS, 193, 189 [NASA ADS] [CrossRef] [Google Scholar]
- Fang, J. J., Faber, S. M., Koo, D. C., & Dekel, A. 2013, ApJ, 776, 63 [NASA ADS] [CrossRef] [Google Scholar]
- Ferguson, A. M. N., & Clarke, C. J. 2001, MNRAS, 325, 781 [Google Scholar]
- Franx, M., & Illingworth, G. 1990, ApJ, 359, L41 [NASA ADS] [CrossRef] [Google Scholar]
- Gadotti, D. A., & Sánchez-Janssen, R. 2012, MNRAS, 423, 877 [NASA ADS] [CrossRef] [Google Scholar]
- Genel, S., Vogelsberger, M., Springel, V., et al. 2014, MNRAS, 445, 175 [Google Scholar]
- Genel, S., Nelson, D., Pillepich, A., et al. 2018, MNRAS, 474, 3976 [Google Scholar]
- Grand, R. J. J., Gómez, F. A., Marinacci, F., et al. 2017, MNRAS, 467, 179 [NASA ADS] [Google Scholar]
- Guo, Q., White, S., Boylan-Kolchin, M., et al. 2011, MNRAS, 413, 101 [Google Scholar]
- Hardwick, J. A., Cortese, L., Obreschkow, D., Catinella, B., & Cook, R. H. W. 2022, MNRAS, 509, 3751 [Google Scholar]
- Hoyle, F. 1951, Probl. Cosm. Aerodyn., 195 [Google Scholar]
- Jiang, F., Dekel, A., Kneller, O., et al. 2019, MNRAS, 488, 4801 [NASA ADS] [CrossRef] [Google Scholar]
- Krajnović, D., Cappellari, M., & McDermid, R. M. 2018, MNRAS, 473, 5237 [CrossRef] [Google Scholar]
- Lagos, C. D. P., Theuns, T., Stevens, A. R. H., et al. 2017, MNRAS, 464, 3850 [NASA ADS] [CrossRef] [Google Scholar]
- Lang, P., Wuyts, S., Somerville, R. S., et al. 2014, ApJ, 788, 11 [NASA ADS] [CrossRef] [Google Scholar]
- Lange, R., Driver, S. P., Robotham, A. S. G., et al. 2015, MNRAS, 447, 2603 [CrossRef] [Google Scholar]
- Liang, J., Jiang, F., Mo, H., et al. 2024, ArXiv e-prints [arXiv:2403.14749] [Google Scholar]
- Lu, S., Xu, D., Wang, S., et al. 2022, MNRAS, 509, 2707 [Google Scholar]
- Lyu, C., Peng, Y., Jing, Y., et al. 2023, ApJ, 959, 5 [NASA ADS] [CrossRef] [Google Scholar]
- Mancera Piña, P. E., Posti, L., Fraternali, F., Adams, E. A. K., & Oosterloo, T. 2021, A&A, 647, A76 [NASA ADS] [CrossRef] [EDP Sciences] [Google Scholar]
- Marinacci, F., Vogelsberger, M., Pakmor, R., et al. 2018, MNRAS, 480, 5113 [NASA ADS] [Google Scholar]
- Martig, M., Bournaud, F., Teyssier, R., & Dekel, A. 2009, ApJ, 707, 250 [Google Scholar]
- Mo, H. J., Mao, S., & White, S. D. M. 1998, MNRAS, 295, 319 [Google Scholar]
- Naab, T., & Ostriker, J. P. 2017, ARA&A, 55, 59 [Google Scholar]
- Naab, T., Johansson, P. H., & Ostriker, J. P. 2009, ApJ, 699, L178 [Google Scholar]
- Naiman, J. P., Pillepich, A., Springel, V., et al. 2018, MNRAS, 477, 1206 [Google Scholar]
- Nelson, D., Pillepich, A., Genel, S., et al. 2015, Astron. Comput., 13, 12 [Google Scholar]
- Nelson, D., Pillepich, A., Springel, V., et al. 2018, MNRAS, 475, 624 [Google Scholar]
- Nelson, D., Springel, V., Pillepich, A., et al. 2019a, Comput. Astrophys. Cosmol., 6, 2 [Google Scholar]
- Nelson, D., Pillepich, A., Springel, V., et al. 2019b, MNRAS, 490, 3234 [Google Scholar]
- Ormerod, K., Conselice, C. J., Adams, N. J., et al. 2024, MNRAS, 527, 6110 [Google Scholar]
- Peebles, P. J. E. 1969, ApJ, 155, 393 [Google Scholar]
- Peng, Y.-J., & Renzini, A. 2020, MNRAS, 491, L51 [Google Scholar]
- Pérez-Montaño, L. E., Rodriguez-Gomez, V., Cervantes Sodi, B., et al. 2022, MNRAS, 514, 5840 [CrossRef] [Google Scholar]
- Pillepich, A., Springel, V., Nelson, D., et al. 2018, MNRAS, 473, 4077 [Google Scholar]
- Pillepich, A., Nelson, D., Springel, V., et al. 2019, MNRAS, 490, 3196 [Google Scholar]
- Planck Collaboration XIII. 2016, A&A, 594, A13 [NASA ADS] [CrossRef] [EDP Sciences] [Google Scholar]
- Posti, L., Fraternali, F., Di Teodoro, E. M., & Pezzulli, G. 2018a, A&A, 612, L6 [NASA ADS] [CrossRef] [EDP Sciences] [Google Scholar]
- Posti, L., Pezzulli, G., Fraternali, F., & Di Teodoro, E. M. 2018b, MNRAS, 475, 232 [NASA ADS] [CrossRef] [Google Scholar]
- Rodriguez-Gomez, V., Genel, S., Vogelsberger, M., et al. 2015, MNRAS, 449, 49 [Google Scholar]
- Rodriguez-Gomez, V., Pillepich, A., Sales, L. V., et al. 2016, MNRAS, 458, 2371 [Google Scholar]
- Rodriguez-Gomez, V., Sales, L. V., Genel, S., et al. 2017, MNRAS, 467, 3083 [Google Scholar]
- Rodriguez-Gomez, V., Genel, S., Fall, S. M., et al. 2022, MNRAS, 512, 5978 [NASA ADS] [CrossRef] [Google Scholar]
- Romanowsky, A. J., & Fall, S. M. 2012, ApJS, 203, 17 [Google Scholar]
- Roškar, R., Debattista, V. P., Quinn, T. R., & Wadsley, J. 2012, MNRAS, 426, 2089 [Google Scholar]
- Sales, L. V., Navarro, J. F., Theuns, T., et al. 2012, MNRAS, 423, 1544 [Google Scholar]
- Sánchez-Menguiano, L., Sánchez Almeida, J., Sánchez, S. F., & Muñoz-Tuñón, C. 2024, A&A, 681, A121 [NASA ADS] [CrossRef] [EDP Sciences] [Google Scholar]
- Scott, N., Cappellari, M., Davies, R. L., et al. 2009, MNRAS, 398, 1835 [NASA ADS] [CrossRef] [Google Scholar]
- Scott, N., Brough, S., Croom, S. M., et al. 2017, MNRAS, 472, 2833 [NASA ADS] [CrossRef] [Google Scholar]
- Shen, S., Mo, H. J., White, S. D. M., et al. 2003, MNRAS, 343, 978 [NASA ADS] [CrossRef] [Google Scholar]
- Shi, J., Lapi, A., Mancuso, C., Wang, H., & Danese, L. 2017, ApJ, 843, 105 [NASA ADS] [CrossRef] [Google Scholar]
- Sijacki, D., Vogelsberger, M., Genel, S., et al. 2015, MNRAS, 452, 575 [NASA ADS] [CrossRef] [Google Scholar]
- Somerville, R. S., & Davé, R. 2015, ARA&A, 53, 51 [Google Scholar]
- Somerville, R. S., Barden, M., Rix, H.-W., et al. 2008, ApJ, 672, 776 [NASA ADS] [CrossRef] [Google Scholar]
- Springel, V. 2010, MNRAS, 401, 791 [Google Scholar]
- Springel, V., White, S. D. M., Tormen, G., & Kauffmann, G. 2001, MNRAS, 328, 726 [Google Scholar]
- Springel, V., Pakmor, R., Pillepich, A., et al. 2018, MNRAS, 475, 676 [Google Scholar]
- van den Bosch, F. C. 1998, ApJ, 507, 601 [NASA ADS] [CrossRef] [Google Scholar]
- Varela-Lavin, S., Gómez, F. A., Tissera, P. B., et al. 2023, MNRAS, 523, 5853 [NASA ADS] [CrossRef] [Google Scholar]
- Vaughan, S. P., Barone, T. M., Croom, S. M., et al. 2022, MNRAS, 516, 2971 [CrossRef] [Google Scholar]
- Vogelsberger, M., Genel, S., Springel, V., et al. 2014, Nature, 509, 177 [Google Scholar]
- Wang, S., Xu, D., Lu, S., et al. 2022, MNRAS, 509, 3148 [Google Scholar]
- Weinberger, R., Springel, V., Hernquist, L., et al. 2017, MNRAS, 465, 3291 [Google Scholar]
- Weinberger, R., Springel, V., Pakmor, R., et al. 2018, MNRAS, 479, 4056 [Google Scholar]
- White, S. D. M. 1984, ApJ, 286, 38 [NASA ADS] [CrossRef] [Google Scholar]
- Yang, C., Zhu, L., Tahmasebzadeh, B., Xue, X.-X., & Liu, C. 2022, AJ, 164, 241 [NASA ADS] [CrossRef] [Google Scholar]
- Yang, H., Gao, L., Frenk, C. S., et al. 2023, MNRAS, 518, 5253 [Google Scholar]
- Yoshii, Y., & Sommer-Larsen, J. 1989, MNRAS, 236, 779 [NASA ADS] [CrossRef] [Google Scholar]
- Zanisi, L., Shankar, F., Lapi, A., et al. 2020, MNRAS, 492, 1671 [NASA ADS] [CrossRef] [Google Scholar]
- Zavala, J., Frenk, C. S., Bower, R., et al. 2016, MNRAS, 460, 4466 [NASA ADS] [CrossRef] [Google Scholar]
- Zhu, Q., Pérez-Montaño, L. E., Rodriguez-Gomez, V., et al. 2023, MNRAS, 523, 3991 [NASA ADS] [CrossRef] [Google Scholar]
All Tables
Best-fit parameters for the mass-size-X scaling relations of central disk galaxies in TNG.
All Figures
|
Fig. 1. Stellar mass-size relation for the central disk galaxies with tiny stellar halos we selected in the TNG50 simulation at z = 0. A linear fit of the mass-size correlation is represented by the solid black line. We categorize galaxies based on their deviation within ±0.5σ from the linear fit, as the dashed lines indicate. Galaxies falling within the range of −0.5σ to 0.5σ are identified as ‘normal galaxies’ (green dots), those exceeding 0.5σ are labeled as ‘extended galaxies’ (blue dots), and those falling below −0.5σ are designated as ‘compact galaxies’ (red dots). The dotted lines partition the galaxies into four mass bins (M1–M4) encompassing 109 − 9.5 M⊙, 109.5 − 10 M⊙, 1010 − 10.5 M⊙, and 1010.5 − 11.5 M⊙. The bottom of this figure provides the count of galaxies of each type within M1–M4. |
| In the text | |
|
Fig. 2. Surface density distributions of stars and cold gas in the face-on view of compact (left), normal (middle), and extended (right) galaxies at z = 0, 1, 1.5, 2. From top to bottom, we show the evolution of stellar and cold gas. Their stellar mass M⋆ and 2D half-mass radius R1/2 are given on the left-hand corner of each panel. |
| In the text | |
|
Fig. 3. Properties of galaxies in our sample at z = 0. Panel a: Black hole mass as a function of stellar mass for the compact, normal, and extended galaxies. The top and right sub-panels show the histograms computed from all galaxies, respectively. Panel b: Ex situ mass fraction facc as a function of the stellar mass and the histogram distributions. |
| In the text | |
|
Fig. 4. Evolutionary trajectory of the galaxy we have chosen in terms of its half-mass radius, R1/2, growth. Each solid line corresponds to a specific galaxy, color-coded according to ΔR1/2. The bold solid lines and shaded areas indicate the median and the 1σ variation for compact (red), normal (green), and extended (blue) galaxies. The galaxies are categorized into M1–M4 from left to right. Vertical dashed lines are the time at a redshift of z = 2. |
| In the text | |
|
Fig. 5. Mass growth history of dark matter halo, gas, cold gas, and stars (from top to bottom) in compact (red), normal (green), and extended (blue) galaxies we selected. The solid profiles and shaded regions represent the median and 1σ envelope. From left to right, the galaxies are organized as M1–M4. |
| In the text | |
|
Fig. 6. Angular momentum growth history of dark matter halos, gas, cold gas, and stars (from top to bottom) in compact (red), normal (green), and extended (blue) galaxies we selected. The solid profiles and shaded regions represent the median and 1σ envelope. From left to right, the galaxies are organized as M1–M4. |
| In the text | |
|
Fig. 7. Cumulative distribution of baryonic to dark matter mass ratio of the group or cluster environment that compact (red), normal (green), and extended (blue) galaxies belong to at z = 2 (dash) and z = 0 (solid). |
| In the text | |
|
Fig. 8. Bulge-to-total mass ratio, fbulge, as a function of the stellar mass of the galaxy sample we selected. The solid and dashed profiles are results measured by kinematic and morphological methods, respectively. The shaded regions represent the 1σ envelope of kinematic fbulge. |
| In the text | |
|
Fig. 9. Star formation rate history of compact (red), normal (green), and extended (blue) galaxies we select. The vertical dashed lines mark the time of redshift z = 2. The solid profiles and shaded regions represent the median and 1σ envelopes. From left to right, the galaxies are divided into four mass ranges: M1–M4. |
| In the text | |
|
Fig. 10. Star formation rate as a function of stellar mass. The colored solid lines represent compact (red), normal (green), and extended (blue) galaxies, respectively. The criterion indicated by the black dashed line, as proposed by Lyu et al. (2023), is used to differentiate between star-forming and quenched galaxies. |
| In the text | |
|
Fig. 11. Stellar mass-size relation for the galaxies in the TNG50 simulation at z = 0. From left to right: Data are color-coded by the stellar metallicity (Z⋆), gas metallicity (Zgas), galaxy formation time (tform), black hole mass (MBH), and stellar density measure within central 1 kpc in the cylindrical coordinate (Σ1 (2D)). Diagonal dashed lines represent lines of constant velocity dispersion, calculated using the formula |
| In the text | |
Current usage metrics show cumulative count of Article Views (full-text article views including HTML views, PDF and ePub downloads, according to the available data) and Abstracts Views on Vision4Press platform.
Data correspond to usage on the plateform after 2015. The current usage metrics is available 48-96 hours after online publication and is updated daily on week days.
Initial download of the metrics may take a while.