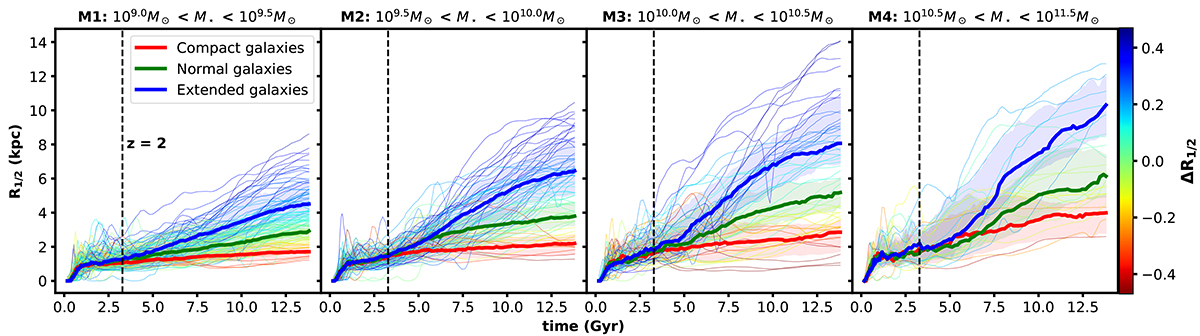
Fig. 4.
Download original image
Evolutionary trajectory of the galaxy we have chosen in terms of its half-mass radius, R1/2, growth. Each solid line corresponds to a specific galaxy, color-coded according to ΔR1/2. The bold solid lines and shaded areas indicate the median and the 1σ variation for compact (red), normal (green), and extended (blue) galaxies. The galaxies are categorized into M1–M4 from left to right. Vertical dashed lines are the time at a redshift of z = 2.
Current usage metrics show cumulative count of Article Views (full-text article views including HTML views, PDF and ePub downloads, according to the available data) and Abstracts Views on Vision4Press platform.
Data correspond to usage on the plateform after 2015. The current usage metrics is available 48-96 hours after online publication and is updated daily on week days.
Initial download of the metrics may take a while.