Fig. 1.
Download original image
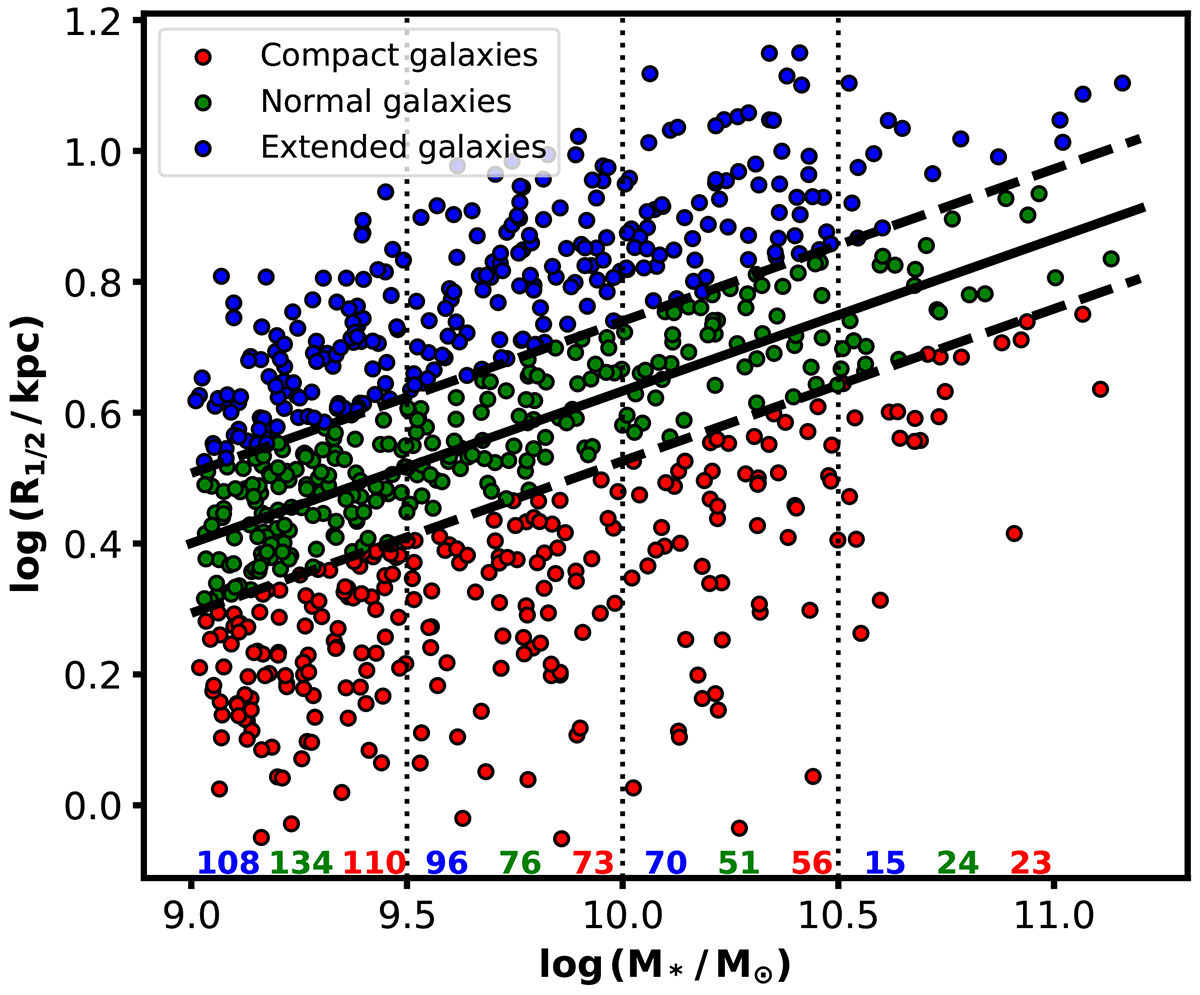
Stellar mass-size relation for the central disk galaxies with tiny stellar halos we selected in the TNG50 simulation at z = 0. A linear fit of the mass-size correlation is represented by the solid black line. We categorize galaxies based on their deviation within ±0.5σ from the linear fit, as the dashed lines indicate. Galaxies falling within the range of −0.5σ to 0.5σ are identified as ‘normal galaxies’ (green dots), those exceeding 0.5σ are labeled as ‘extended galaxies’ (blue dots), and those falling below −0.5σ are designated as ‘compact galaxies’ (red dots). The dotted lines partition the galaxies into four mass bins (M1–M4) encompassing 109 − 9.5 M⊙, 109.5 − 10 M⊙, 1010 − 10.5 M⊙, and 1010.5 − 11.5 M⊙. The bottom of this figure provides the count of galaxies of each type within M1–M4.
Current usage metrics show cumulative count of Article Views (full-text article views including HTML views, PDF and ePub downloads, according to the available data) and Abstracts Views on Vision4Press platform.
Data correspond to usage on the plateform after 2015. The current usage metrics is available 48-96 hours after online publication and is updated daily on week days.
Initial download of the metrics may take a while.