Fig. 4.
Download original image
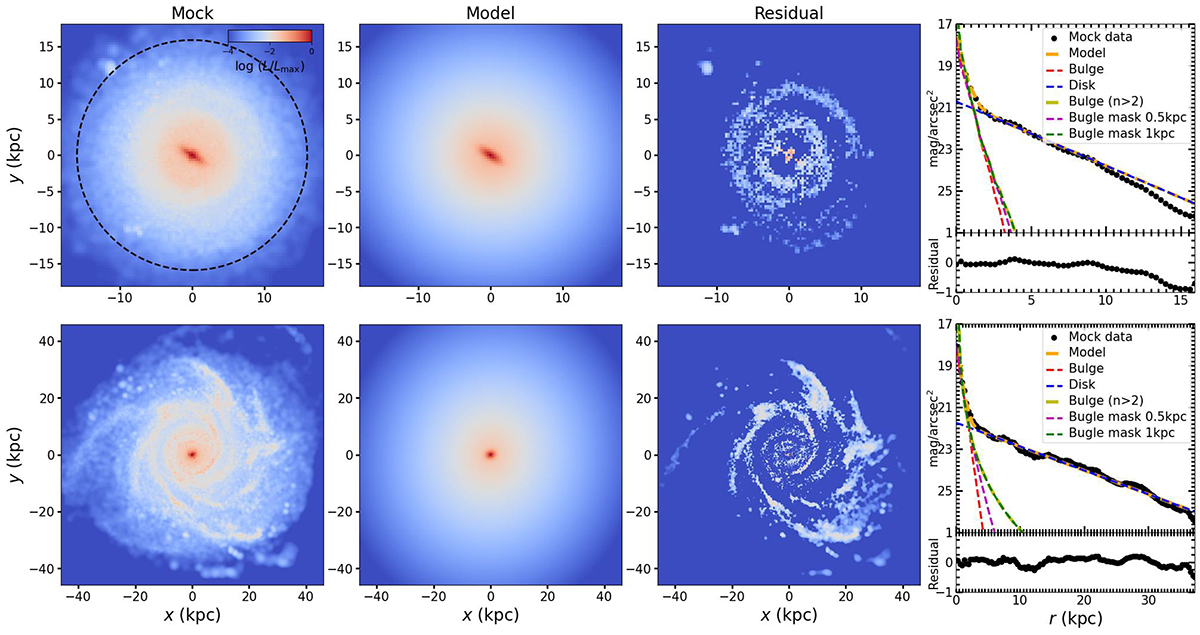
Example of photometric decomposition for a face-on galaxy (ID = 513105, 455292). The first column shows the face-on mock image generated through the GALAXEV pipeline. The dashed black line represents a circle drawn at the average radius where the pixel value equals 1, distinguishing the background from the stellar halo. The second column presents the two-component GALFIT model (bulge + disk). The third column displays the residuals, where the pixel values are normalized by the maximum value of each galaxy. The fourth column shows the surface brightness profile fitting results.
Current usage metrics show cumulative count of Article Views (full-text article views including HTML views, PDF and ePub downloads, according to the available data) and Abstracts Views on Vision4Press platform.
Data correspond to usage on the plateform after 2015. The current usage metrics is available 48-96 hours after online publication and is updated daily on week days.
Initial download of the metrics may take a while.