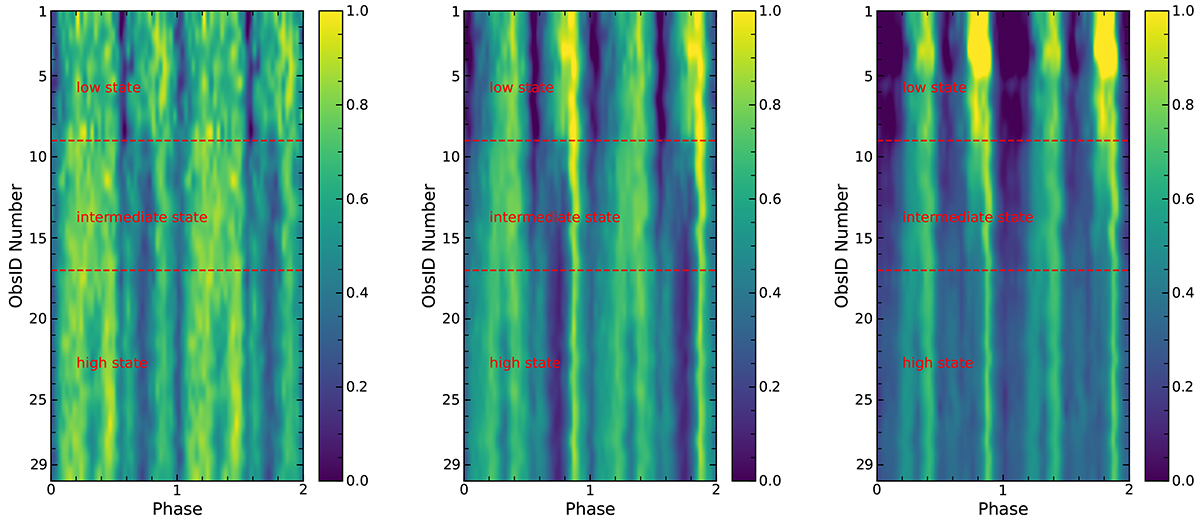
Fig. 2.
Download original image
Pulse profile map normalised to the range of 0−1 for all Insight-HXMT observations of the 2018 outburst, sorted by ObsID number (in ascending order of flux). This figure illustrates the flux dependence of the pulse profiles in the LE (the left panel), ME (the middle panel), and HE (the right panel) energy bands. The dashed red lines indicate the two flux levels (ObsID ∼ 9 and 17) where the profile shape changes.
Current usage metrics show cumulative count of Article Views (full-text article views including HTML views, PDF and ePub downloads, according to the available data) and Abstracts Views on Vision4Press platform.
Data correspond to usage on the plateform after 2015. The current usage metrics is available 48-96 hours after online publication and is updated daily on week days.
Initial download of the metrics may take a while.