| Issue |
A&A
Volume 694, February 2025
|
|
|---|---|---|
| Article Number | A156 | |
| Number of page(s) | 10 | |
| Section | Astrophysical processes | |
| DOI | https://doi.org/10.1051/0004-6361/202451634 | |
| Published online | 11 February 2025 | |
Timing and spectral studies of the Be/X-ray binary EXO 2030+375 using Insight-HXMT observations
1
Institut für Astronomie und Astrophysik, Universität Tübingen, Sand 1, D-72076 Tübingen, Germany
2
ISDC Data Center for Astrophysics, Université de Genève, 16 Chemin d’Écogia, 1290 Versoix, Switzerland
3
School of Physics and Astronomy, Sun Yat-Sen University, Zhuhai 519082, PR China
4
Institute of Astrophysics, Central China Normal University, Wuhan 430079, PR China
⋆ Corresponding author; du@astro.uni-tuebingen.de
Received:
23
July
2024
Accepted:
13
December
2024
We report the results of a X-ray spectral and timing analysis of the high mass X-ray binary EXO 2030+375 during the 2021 type-II outburst based on Insight-HXMT observations. We confirm that pulsations can be detected in the energy band of 1−150 keV. The pulse profile shows both energy and luminosity dependence and variability. We observed transitions in the pulse profile shape during the rising and the decaying phase of the outburst. The pulse fraction (PF) exhibits an anti-correlation with the luminosity and a non-monotonic energy dependence, with a possible dip near 30 keV during the outburst peak. The hardness-intensity diagrams (7−10 keV/4−7 keV) suggests transitions in state during the early and late phases of the outburst. These transitions are consistent with the luminosity at which the pulse profile shape changes occur, revealing the source reached a critical luminosity and transitioned between super-critical and sub-critical accretion regimes. We performed an average and phase-resolved spectral analysis, where the flux-resolved average spectra show a stable spectral evolution with luminosity. The phase-resolved spectral analysis reveals that the dependence of spectral parameters on the pulse phase varies with changing luminosities.
Key words: accretion / accretion disks / binaries: general / pulsars: general / pulsars: individual: EXO 2030+375
© The Authors 2025
 Open Access article, published by EDP Sciences, under the terms of the Creative Commons Attribution License (https://creativecommons.org/licenses/by/4.0), which permits unrestricted use, distribution, and reproduction in any medium, provided the original work is properly cited.
This article is published in open access under the Subscribe to Open model. Subscribe to A&A to support open access publication.
1. Introduction
Be/X-ray binary (BeXRB) systems consist of an accreting neutron star (NS) characterized by B ∼ 1012 G and a O/B spectral main sequence or giant donor star (Maraschi et al. 1976; Reig 2011). In these systems, the NS can accrete matter supplied by the companion star primarily via the stellar wind or the circumstellar disc, thereby producing emission in the X-ray domain. The apparent luminosity covers many orders of magnitude from ∼1032 erg s−1 up to ∼1041 erg s−1 (see a recent review by Mushtukov & Tsygankov 2023). Besides the periodic (type-I) X-ray outbursts characterized by lower luminosity of roughly LX < 1037 erg s−1 often observed at the periastron passage of the NS, giant outbursts (type-II) are also observed in BeXRBs with peak luminosity of LX ≥ 1037 erg s−1 (Reig 2011).
In these binary systems, the plasma is channeled along the magnetic field of the neutron star and accretes onto the polar cap, where the gravitational energy of the flow is released. It is believed that at luminosities greater than the critical luminosity (Lcrit ≈ 1036 − 37 erg s−1), the plasma flow is decelerated above the NS surface by the radiative pressure, leading to the formation of a radiatively dominated shock above the polar cap and the creation of an extended emission region, known as the accretion column (Basko & Sunyaev 1976; Becker et al. 2012). The pulse profiles and X-ray spectra of accreting pulsars show different properties below and above Lcrit. For example, the shapes of the pulse profile of many pulsars show a significant variability around Lcrit (Tsygankov et al. 2018; Ji et al. 2020; Wang et al. 2022). Another observational tool typically used to infer properties about the different accretion regimes around Lcrit is provided by cyclotron resonant scattering features (CRSFs), which are absorption-like lines in the continuum spectrum, produced by the quantized motion of electrons in strong magnetic fields. CRSFs provide a direct measurement of the magnetic field, Ecyc ≈ 11.6 × B12 × (1 + z)−1 keV (Staubert et al. 2019), where B12 is the surface magnetic field strength in units of 1012 G, z is the gravitational redshift due to the NS mass and radius. The energy of the fundamental CRSF shows a correlation with luminosity below Lcrit and an anti-correlation above it (Mushtukov & Tsygankov 2023, and references therein). Studies on the transition occurring around Lcrit between different accretion regimes are crucial to improving our understanding of the dynamic of accretion flow geometry and radiation mechanisms in pulsars with high magnetic fields. In this work, we present a spectral and timing analysis of one of these pulsars, EXO 2030+375, using 1−150 keV data from the Insight-HXMT satellite obtained during the 2021 giant outburst. EXO 2030+375 is a transient BeXRB discovered by the EXOSAT observatory during a type-II outburst in 1985. It hosts a ∼42 s pulsar orbiting around the companion star in a rather eccentric orbit (Porb ≈ 46 d, e ∼ 0.41; Parmar et al. 1985, 1989). Its distance has been estimated as  kpc by the Gaia Data Release 3 (Bailer-Jones et al. 2021).
Various interesting features have been observed in the broad band spectrum of EXO 2030+375. During a type-I outburst in 1996 observed by RXTE, Reig & Coe (1999) reported the possible detection of CRSF with a centroid energy of ∼36 keV. EXO 2030+375 was observed to undergo a second type-II outburst in 2006. A broad Gaussian emission feature around 15 keV has been observed (Klochkov et al. 2007). A possible CRSF was reported at ∼63 keV in phase-resolved spectra extracted during the peak of the 2006 outburst (Klochkov et al. 2008a). Suzaku observations of EXO 2030+375 during type-I outbursts in 2007 and 2012 did not reveal the presence of CRSFs in the X-ray spectrum (Ferrigno et al. 2016). The third giant outburst was detected in 2021. Fu et al. (2023) reported the evolution of the pulse profile with luminosity and provided an updated set of orbital and temporal parameters of EXO 2030+375 with Insight-HXMT. During a 2022 type-I outburst, Malacaria et al. (2023) used IXPE to find that the polarization degree ranged from 0% to 3% in phase-averaged analysis and from 2% to 7% in phase-resolved analysis. Their combined polarimetric, spectral, and timing analyses revealed a complex accretion geometry for EXO 2030+375, significantly influenced by asymmetric magnetic multipoles and gravitational light bending.
In this work, we present the spectral and timing analysis of EXO 2030+375, using the data of Insight-HXMT during the 2021 giant outburst. The observations and data processing are given in Sect. 2. We present the dependence of the pulse profile with time and energy. We analyzed phase-averaged, phase-resolved spectra of the 2021 outburst to explore spectral variations. The results are given in Sect. 3. In Sects. 4 and 5, we discuss and summarize our results. Additionally, we provide supplementary results that support our main findings in the appendix.
2. Observations and data reduction
The Hard X-ray Modulation Telescope (Insight-HXMT, also known as HXMT; Zhang et al. 2020), launched on 15th June 2017, is the first Chinese X-ray astronomical satellite. HXMT excels in its broad energy band (1−250 keV) and a large effective area in the hard X-rays energy band (Zhang et al. 2020). EXO 2030+375 was observed by Insight-HXMT from 2021 July 28 (MJD 59423) to November 21 (MJD 59539). Figure 1 presents the light curves of EXO 2030+375 during the 2021 giant outburst. The top panel displays the 2−20 keV light curve observed by MAXI1 (Matsuoka et al. 2009), while the bottom panel shows the light curve derived from the Insight-HXMT observations through spectral fitting. There are 65 observations of the proposal P0304030 and 15 observations of the proposal P0404147, with a total exposure time of ∼2460 ks. Especially, observations of the proposal P0404147 were at the peak of the outburst. The observations utilized for the timing and spectral analysis of the source can be found in Appendix A (Table A.1) The exposures were combined by date to enhance the statistics using addspec in heasoft (version 6.31.1). The detectors of three payloads (LE: 1−15 keV, 384 cm2; ME: 5−30 keV, 952 cm2; HE: 20−250 keV, 2100 cm2) on board Insight-HXMT were used to generate the events in good time intervals (GTIs). The time resolution of the HE, ME, and LE instruments are ∼25 μs, ∼280 μs, and ∼1 ms, respectively. Data from Insight-HXMT were considered in the range 2−150 keV, with the exclusion of 21−23 keV data due to the presence of an Ag feature (Li et al. 2020). Insight-HXMT Data Analysis software2 (HXMTDAS) v2.04 and HXMTCALDB v2.04 were used to analyze the data. We screened events for three payloads in HXMTDAS using legtigen, megtigen, hegtigen tasks according to the following criteria for the selection of GTIs: (1) pointing offset angle < 0.1°; (2) the elevation angle > 10°; (3) the geomagnetic cut-off rigidity > 8 GeV; (4) the time before and after the South Atlantic Anomaly passage > 300 s; and (5) for LE observations, pointing direction above bright Earth > 30°. We selected events from the small field of views (FoVs) for LE and ME observations, as well as from both small and large FoVs for HE observations due to the limitation of the background calibration. HXMT is a non-imaging telescope, the background is generated using a background model constructed through training and calibration on multiple calibration sources of the blind detectors, which are covered by tantalum lid. The software for background realization is incorporated in lebkgmap (Cao et al. 2020), mebkgmap (Cao et al. 2020), and hebkgmap (Liu et al. 2020) implemented in HXMTDAS, respectively. The arrival times of photons at HXMT are corrected to the Solar system barycentre by hxbary in HXMTDAS. The correction of the arrival times to account for the orbital modulation was performed using the orbital ephemeris reported by Fu et al. (2023). The XSPEC v12.13.0c software package (Arnaud 1996) was used to perform the spectral fitting. We included renormalisation constant factors in all the spectral fittings to account for inter-calibration uncertainties between the three Insight-HXMT instruments. The uncertainty estimated for each spectral parameter is for 90% confidence, and a systematic error of 1% is added to LE, ME, and HE spectrum.
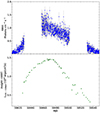 |
Fig. 1. Light curve of EXO 2030+375 as measured by MAXI (2−20 keV), with data binned over one orbital revolution of the International Space Station, where MAXI is mounted (∼1.5 hours), shown in the first panel. The second panel shows the light curve from the Insight-HXMT observations during the 2021 giant outburst. Each point represents the daily-averaged luminosity (0.01−150 keV), derived through spectral fitting of the Insight-HXMT data. |
3. Results
3.1. Timing analysis
The 0.01−150 keV light curve of the 2021 outburst is presented in the second panel of Fig. 1. Luminosities were derived from the spectral analysis detailed in Sect. 3.2. The outburst reaches its maximum luminosity at MJD 59466. The duration of the rising phase of the outburst is approximately 40 days, spanning from MJD 59427 to MJD 59466, and covering a luminosity range of 0.55 × 1037 erg s−1 to 1.45 × 1037 erg s−1. The duration of the decay phase is approximately 69 days, spanning from MJD 59466 to MJD 59535, and covering a luminosity range of 1.45 × 1037 erg s−1 to 0.31 × 1037 erg s−1.
Figure 2 shows the temporal evolution of the pulse profiles of EXO 2030+375. To enhance the statistics, data within one day was combined. To accurately measure the spin period for timing analysis, we performed epoch folding (Leahy 1987) on the extracted light curves. The profiles were obtained from light curves with a bin size of 0.5 s extracted in three energy bands (LE: 1−10 keV, ME: 10−30 keV, HE: 25−100 keV). The pulse profiles were aligned, with phase zero defined as the minimum value of the pulse profile.
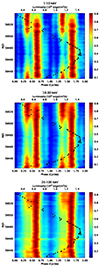 |
Fig. 2. 2D maps describe the evolution of the pulse profile with time observed by Insight-HXMT during the 2021 outburst (proposal P0304030 and P0404147, MJD 59427−59535). Top: 1−10 keV; middle: 10−30 keV; and bottom: 25−100 keV. The black points in the figure represent the luminosity (0.01−150 keV). |
A two-peak structure at lower flux can be clearly identified for the 1−10 keV and 10−30 keV energy bands. The main peak at ∼0.60 phase remains stable throughout the outburst, with its intensity decreasing near the end. Conversely, as the outburst rises, the intensity of the secondary peak at ∼0.35 phase decreases. When the luminosity exceeds ∼1.0 × 1037 erg s−1, the intensity of the secondary peak remains relatively low until the luminosity decreases back to ∼1.0 × 1037 erg s−1. At this point, the intensity of the secondary peak increases again, gradually becoming higher than that of the main peak, with the secondary peak eventually becoming dominant as the main peak’s amplitude decreases. For HE, the secondary peak is not as prominent as it is for LE and ME; the main peak remains more dominant. However, higher intensity can still be observed at phase 0.3−0.5 at lower luminosities. In general, the secondary peak at ∼0.35 phase dominates at lower luminosities, while the main peak at ∼0.60 phase dominates at higher luminosities.
Figure 3 presents the energy-resolved (1−10, 10−15, 15−20, 20−30, 30−40, 40−50, 50−60, 60−70, 70−100, 25−100, and 100−150 keV) background-subtracted pulse profiles of the source obtained near the maximum of the 2021 outburst (ObsID P0404147, MJD 59460−59461). The four-peak pulse profile evolves to a single peak as the energy increases. The small peak at ∼0.1 phase gradually decreases with increasing energy and is no longer detectable above 30 keV. Another small peak at ∼0.9 phase gradually decreases when the energy exceeds 40 keV. The main peak at ∼0.60 phase was dominant at all energy bands while the secondary peak at ∼0.35 phase can only be detected below 70 keV. Pulsations can still be detected above 100 keV.
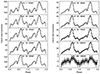 |
Fig. 3. Energy-resolved pulse profiles of EXO 2030+375 near the maximum of the outburst. |
We defined the pulse fraction (PF) parameter as the ratio of the difference to the sum of the maximum, Pmax, and minimum, Pmin, intensities of pulse profile, PF =  . The variations in the PL with the energy at different luminosities during the rise (L ∼ 1.16 × 1037 erg s−1), near the peak (L ∼ 1.40 × 1037 erg s−1), and during the decay (L ∼ 5.56 × 1036 erg s−1) are shown in Fig. 4. The horizontal errors represent the energy ranges for which the PF is calculated, and the vertical errors indicate the corresponding error in PF measurements. In general, the pulse fraction increases with energy, while a bump around 10 keV was observed near the peak of the outburst. Figure 5 shows the variation in the pulse fraction (25−100 keV) with the luminosity throughout the outburst, revealing an anti-correlation between the pulse fraction and luminosity during both the rise and decay phases.
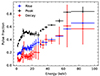 |
Fig. 4. Variation in the PF with energy (keV). Rise: P0304030016, L ∼ 1.16 × 1037 erg s−1. Peak: P0404147, and L ∼ 1.40 × 1037 erg s−1. Decay: P0304030060, L ∼ 5.56 × 1036 erg s−1. |
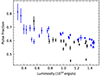 |
Fig. 5. Variation in pulse fraction with luminosity in 25−100 keV energy range during the 2021 outburst. Black crosses represent the rise of the outburst, blue the decay. |
3.2. Phase-averaged analysis
The outbursts of accreting pulsars typically go through different spectral states, which can be diagnosed using a hardness-intensity diagram (HID) (Reig & Nespoli 2013). HID shows how a source spectral hardness – defined as the ratio of count per second (or flux) between two distinct X-ray energy bands – varies with its total intensity. Figure 6 displays the net light curves in the energy ranges of 4−7 keV and 7−10 keV for all observations, as well as the hardness ratio of 7−10 keV/4−7 keV versus time. The light curves are rebinned to one–day intervals. The hardness ratio is divided into four parts, represented by different colors, to illustrate its evolution over time. Figure 7 displays the HID.
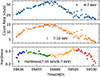 |
Fig. 6. Net light curves and hardness of EXO 2030+375 of all observations from MJD 59427 to MID 59535. The hardness is defined as the ratio 7−10 keV/4−7 keV. Each point corresponds to the data of one day. The evolution of hardness over time is represented by dividing it into four distinct periods, each indicated by a different color: blue (MJD 59427 to 59438), green (MJD 59438 to 59473), orange (MJD 59473 to 59508), and red (MJD 59508 to 59535). |
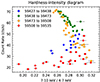 |
Fig. 7. HID extracted from Insight- HXMT/LE data. Hardness is defined as the ratio 7−10 keV/4−7 keV. The colors are described in the same way as in Figure 6. |
Table A.1 lists all the observations. We first focused on the observations near the peak of the 2021 outburst (MJD 59460−59461). To enhance the counting statistics of the energy spectra, we combined seven exposures within a single day (see Table A.1: obs. IDs: 107a, 108a, 109a, 110a, 111a, 112a, and 113a) using the addspec and addrmf tasks. We restricted the energy bands for spectral analysis to 2−10 keV, 10−30 keV, and 28−50 keV for LE, ME, and HE, respectively, due to the relatively higher background above 50 keV.
Our choice of continuum model is based on earlier analyses of EXO 2030+375 (e.g., Klochkov et al. 2007). The model consists of an absorbed cutoff power-law and a blackbody component, the latter included to account for the soft excess observed below ∼5 keV.
In xspec, we employed a cross-normalization constant to fit all instruments jointly and adopted the tbabs absorption model, setting the abundances to wilm (Wilms et al. 2000). We added a Gaussian function centered around ∼6.6 keV, which likely corresponds to higher ionization states of iron, observed in higher luminosity observations (Klochkov et al. 2007; Ferrigno et al. 2016).
Additionally, we included a second Gaussian component at ∼5.7 keV. This feature arises from discrepancies in single-split event count rates across the three LE detector boxes (private communication with the HXMT calibration team). Importantly, this feature does not impact the rest of the analysis or the main results. Panel d in Fig. 8 shows the residuals when the ∼5.7 keV component is excluded from the spectrum: a residual feature appears at ∼6.16 keV. This artifact occurs because the Gaussian component initially included to model the iron line attempts to fit the ∼5.7 keV feature as well.
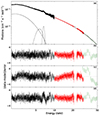 |
Fig. 8. Broadband spectrum of EXO 2030+375 at the peak of the 2021 giant outburst in energy range 2−50 keV using the model const×tbabs(gauss+bbodyrad+gauss+cutoffpl). (a) unfolded spectrum; (b) residuals for the best-fit model; (c) residuals after fitting without the blackbody component; and (d) residuals after fitting without the feature around 5.7 keV. |
The best-fit model, consisting of an absorbed cutoff power-law with a blackbody and two Gaussian components, resulted in a χ2 value of 938.85 for 1250 degrees of freedom. The blackbody temperature was determined to be kT = 0.74 ± 0.03 keV, with the radius of the emitting region estimated at  km, assuming a distance of 2.4 kpc. The best-fit photon index was 0.942 ± 0.025, and the cutoff energy was 18.3 ± 0.5 keV. The interstellar absorption (NH) was found to be (2.32 ± 0.13) × 1022 atoms cm−2. Table 1 provides a comprehensive summary of the spectral parameters derived from the best-fit model.
Best-fit parameters of the phase-averaged broadband spectrum of EXO 2030+375 as observed by Insight-HXMT at the maximum of the outburst using the model const×tbabs(gauss+bbodyrad+gauss+cutoffpl) in the 2−50 keV energy band.
When the spectrum was fitted without the blackbody component, the χ2/d.o.f. increased to 1217.04/1252, and the residuals (Fig. 8, panel c) worsened significantly. In this case, the best-fit required the constant parameter for the HE data (green points in Fig. 8) to shift to a much lower value compared to that listed in Table 1. If this constant is frozen at its previous value, the residuals exhibit a more pronounced wavy structure. To assess the statistical significance of the blackbody component, we performed an F-test, which yielded a probability of 10−70, strongly supporting the inclusion of the blackbody component in the model. Throughout the analysis, the cflux convolution model was used to compute all unabsorbed flux values.
The cutoff power-law with blackbody model discussed above was applied to fit the average spectrum for all the observations. For ObsID P0304030051, P0304030052, P0304030054, P0304030055, and P0304030059, the inclusion of the blackbody component was unnecessary to achieve a good fit. We also investigated spectral variability as a function of accretion luminosity. Given the smooth variation in the spectral parameters throughout the outburst, exploring correlations with X-ray flux is meaningful. The flux-resolved parameters are shown in Fig. 9. The parameters involved are the equivalent hydrogen column density (NH), the photon index (Γ), the folding energy (Ecut), the blackbody temperature (kTbb), and the size of the emitting region (Rbb). The photon index ranges from 0.8 to 1.3, while the cutoff energy varies between 16 keV and 24 keV. Overall, the spectral continuum demonstrates stable evolution with luminosity. Initially, the blackbody temperature rises with luminosity until reaching 0.5 × 1037 erg s−1, beyond which it decreases. The blackbody radius evolves inversely with the temperature.
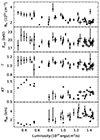 |
Fig. 9. Flux-resolved parameters using all the observations of the 2021 giant outburst in energy range 2−50 keV. |
3.3. Phase-resolved analysis
The phase-resolved spectral analysis of the outburst rise, peak, and decay were performed to explore variations of spectral parameters with pulse phase and different luminosities. Eleven phase bins were selected to sample different intensity levels shown by the pulse profile. To detect the presence of a possible CRSF, we initially extracted spectra across a broader energy range, namely, from 2−100 keV. However, no definitive evidence of CRSF was observed. To minimize the impact of high background and maintain consistency in our spectral analysis, we ultimately narrowed the energy range to 2−50 keV when presenting our results (see Appendix B for more details). To enhance the statistics, observations in the similar flux levels were combined: rise: 59436−59438 MJD, L ∼ 1.0 × 1037 erg s−1; peak: 59460−59461 MJD, L ∼ 1.40 × 1037 erg s−1; decay: 59529−59533 MJD, L ∼ 0.4 × 1037 erg s−1. The spectra obtained for eleven phase bins were fitted again with the same continuum model with the corresponding phase-averaged spectra. During the rise and decay phases of the outburst, when the flux was relatively low, the spectral feature at approximately ∼5.7 keV, identified in the average spectrum near the peak of the outburst (Sect. 3.2), was not required to fit the data in individual phase bins. Consequently, the Gaussian component representing this feature was excluded from the best fit model, which for these parts of the outburst was: const×tbabs×(bbodyrad+gauss+cutoffpl). At the peak of the outburst (59460−59461 MJD), the Gaussian component at ∼5.7 keV was included to account for the observed feature, as in the average spectrum model. The resulting xspec model for this interval was: const×tbabs×(gauss+bbodyrad+gauss+cutoffpl). The best-fit phase-resolved continuum parameters as a function of the pulse phase are reported in Fig. 10. To investigate the variation in the phase-resolved parameters with pulse profile morphology, we generated average pulse profiles for the LE (1−10 keV) energy band across the three time intervals. The LE band was chosen because the evolution of the main peak and the secondary peak with varying luminosities is most evident in this energy range. The disparity in the amplitude of the peaks is clearly observable.
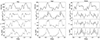 |
Fig. 10. Modulation of phase-resolved parameters observed by Insight-HXMT. Rise: MJD 59436−59438, L ∼ 1.0 × 1037 erg s−1; peak: 59460−59461 MJD, L ∼ 1.45 × 1037 erg s−1; decay: 59529−59533 MJD, L ∼ 0.4 × 1037 erg s−1. For each of the three subfigures, the panels (from top to bottom) show the pulse profile (1−10 keV), the column density (NH), the power-law photon index (Γ), and the cutoff energy (Ecut). |
For all the three time intervals, the power-law photon index shows a strong dependence on the pulse profile. Near the peak of the outburst, it reaches the highest at the main peak at phase ∼0.6. During the rise of the outburst, the photon index remains consistently high on the right flank of the main peak (phase 0.70−0.95). During the decay of the outburst, the amplitude of the main peak is lower and broader than that of the secondary peak at 0.35 phase. The photon index reaches its maximum value at the peak of the secondary peak. For the three time intervals, the cutoff energy varies with pulse phase, reaching its highest value at the peak of the main pulse.
4. Discussion
We have studied spectral and timing characteristics of accreting pulsar EXO 2030+375 in the 2021 outburst with Insight-HXMT. During the observation, the X-ray luminosity (0.01−150 keV) was between 0.31 × 1037 erg s−1 and 1.45 × 1037 erg s−1 assuming the distance of 2.4 kpc.
Reig & Nespoli (2013) presented the hardness-intensity diagram (HID) of the 2006 outburst of EXO 2030+375 (Fig. 3 in Reig & Nespoli 2013), where hardness is defined as the ratio of 7−10 keV to 4−7 keV. The diagram shows a significant transition at a luminosity of ∼4 × 1036 erg s−1 (d = 2.4 kpc). The study indicates that for several X-ray pulsars, including EXO 2030+375, the evolution through the HID suggests state transitions during the early and late phases of the outburst. They demonstrate that these state transitions occur when a critical luminosity is reached. Additionally, the spectral continuum also shows a transition at this luminosity (Fig. 6 in Reig & Nespoli 2013). This indicates that in 2006, EXO 2030+375 likely underwent two different accretion regimes. These regimes are probably associated with the mechanisms by which the accretion flow is decelerated in the accretion column: radiation pressure in the supercritical regime and Coulomb interactions in the subcritical regime (Becker et al. 2012). Using Insight-HXMT data from the 2021 outburst, the HID diagram (7−10 keV/4−7 keV) shows transitions during both the rise and decay phases, indicating changes in the spectral composition. The transitions occur around MJD 59438 (rise phase) and MJD 59507 (decay phase) at LX ∼ 1037 erg s−1.
In the present study, the pulse profile has been observed to evolve with luminosity (Fig. 2). The double-peak structure remains present throughout, with the intensity of the main peak showing minimal variation with luminosity, while the intensity of the secondary peak exhibits significant changes. As shown in Fig. 2, the intensity of the secondary peak decreases during the rising phase, remains constant at a low value and then increases during the falling phase as the flux gradually increases. If we consider the luminosity at which the state transition in HID occurs during the rising phase as the critical luminosity, L ∼ 1.1 × 1037 erg s−1, we observe that the pulse profile shape transition also occurs at this luminosity. In several giant outbursts of accreting pulsars, it has been noted that the transition of the pulse shapes could serve as a hint of critical luminosities; for instance, 2S 1417−624 (Ji et al. 2020), 1A 0535+262 (Wang et al. 2022), and Swift J0243.6+6124 (Tsygankov et al. 2018). This is because the observed pulse profile shape is largely determined by the configuration of the emission region, which depends on the accretion rate. The process of pulse profile formation is complicated and hard to describe using only simple models. However, it is natural to expect a pencil beam pattern from accretion with hot spots on the neutron star surface at sub-critical mass accretion rates. At super-critical mass accretion rates, collisionless shocks and radiation-dominated accretion columns would produce a fan beam pattern (Mushtukov & Tsygankov 2023). If the pulse profile shape transitions are indeed due to EXO 2030+375 reaching a critical luminosity, we can infer that the geometries of the emitting region has always been a mixture of pencil beam and fan beam. The main peak is dominated by the fan beam, while the secondary peak is dominated by the pencil beam, with the pencil beam contributing more at lower luminosities compared to higher luminosities.
For typical neutron star parameters, Becker et al. (2012) derived the critical luminosity as  erg s−1, where B12 is the surface magnetic field strength in units of 1012 G. The value of Lcrit ∼ 1.1 × 1037 erg s−1 corresponds to a magnetic field of 0.7 × 10¹² G. Mushtukov et al. (2015) provided a numerical solution by calculating the luminosity for two scenarios: one with purely extraordinary polarization and another with an equal mix of ordinary and extraordinary polarization. The Lcrit value can only be achieved in the purely extraordinary polarization case. Since the real critical luminosity value is likely to lie between the two cases (as shown in Fig. 7 of that study), the expected cyclotron energy (Ecycl) would be approximately smaller than 5 keV and larger than 30 keV. This corresponds to a magnetic field strength lower than 0.6 × 10¹² G and higher than 3.4 × 10¹² G. Using NICER data, Thalhammer et al. (2024) used relativistic raytracing to model pulse profiles, showing how complex accretion column geometries affect changes in pulse profiles across a range of luminosities. They suggested a critical bolometric luminosity of 2.3 × 1036 erg s−1 for the spectral transition and 7.9 × 1036 erg s−1 for the transition seen in the pulse profiles, deriving a surface magnetic field of 0.17 − 0.55 × 10¹² G. These values are slightly lower than the critical luminosity determined similarly from the Insight-HXMT data. This is probably due to the different energy range used.
The pulse profile also evolved with energy. Observations of the source close to the maximum of the outburst allowed us to perform a detailed study of this dependence (Fig. 3). The low- and high-energy profiles have a very complex structure of up to four peaks at lower energies that eventually merges to become a one-peaked profile at higher energies. The strong energy dependence of the pulse profiles has also been observed from the 2006 outburst by Klochkov et al. (2008a), using INTEGRAL observations in the 2−120 keV energy range. In general, it is a common property for accreting pulsars that they show pulse profiles with a more complex shape at lower energies, while a simple one-peak or two-peak profile at higher energies (see, e.g., Maitra & Paul 2013; Ji et al. 2020; Wang et al. 2022). Variations of pulse profiles with the energy can be caused by changes in the beam pattern on photon energy and/or local absorption due to the non-spherically symmetric distribution of matter within the system. The presence of one-peaked pulses at high energies can be attributed to a fan beam pattern in the emission geometry (Hou et al. 2022). Conversely, interpreting complex pulse profiles at low energies is more challenging due to their susceptibility to scattering and absorption within the neutron star’s local environment.
The energy dependence of the PF has been extensively studied in a large sample of transient Be/X-ray binary pulsars by Lutovinov & Tsygankov (2009), including EXO 2030+375. Lutovinov & Tsygankov (2009) observed that EXO 2030+375 exhibited a consistent increase in PF with energy during its low state, a behavior similarly reported for several other pulsars. Additionally, Klochkov et al. (2008a) observed a bump-like structure around 10−20 keV at peak luminosity that is probably related to the continuum feature they found in this energy range. In our study, we observed a similar bump around 10 keV near peak luminosity, which was not present in lower luminosity states. This suggests that the bump may be luminosity-dependent, warranting further observations of EXO 2030+375 for confirmation. Additionally, the PF shows an anti-correlation with luminosity during both the rise and decay phases (see Fig. 5).
Prior spectral studies of EXO 2030+375 show some complex absorption features in its spectrum and cannot be modeled using a simple cutoff power-law model. Reig & Coe (1999) detected an additional blackbody component with kTbb = 1 − 1.4 keV. and a possible CRSF at ∼36 keV. The radius of the X-ray emission surface is found to be ∼1 km. By using the updated distance of 2.4 kpc, the peak luminosity of their observation is of the order of ∼1036 erg s−1. The best-fit solution of the spectrum of the 2006 giant outburst (L ∼ 1037 erg s−1, d = 2.4 kpc) obtained by Klochkov et al. (2007) required an additional broad emission “bump” at 15 keV or the addition of two Gaussian absorption lines at ∼10 and ∼20 keV. Reig & Nespoli (2013) observed a spectral transition from a negative to positive correlation in the L − Γ diagram at 4 × 1036 erg s−1, suggesting a potential indication of the critical luminosity. Ballhausen et al. (2024) confirms the presence of a narrow absorption feature around 10 keV, its interpretation as CRSF remains uncertain due to the absence of harmonics. They also observed a spectral hardening at lower luminosities during the 2021 outburst. In our study, the broad band spectrum can be modeled by an absorbed cutoff power law associated with a blackbody component and an iron line at ∼6.6 keV. The photon index exhibited no clear evolution with luminosity, contrasting with the results from the 2006 outburst. Typically, spectral transitions are expected to be observed at critical luminosities in X-ray pulsars, reflecting changes between sub-critical and super-critical regimes (Reig & Nespoli 2013; Kong et al. 2020). One possible explanation is that the large error bars at lower luminosities make the spectral variability less evident. Additionally, the luminosity observed during the 2006 outburst by Reig & Nespoli (2013) ranges from 2 × 1035 erg s−1 to 2 × 1037 erg s−1, which is broader than that observed during the 2021 outburst by Insight-HXMT. It might also contribute to the absence of the spectral transition.
We see the strong energy dependence of the pulse profile shape in Fig. 10. The spectral variation with pulse phase is a common feature in X-ray pulsars (see e.g. Klochkov et al. 2008b; Lutovinov et al. 2015). Phase-resolved spectroscopy of EXO 2030+375 was also performed in earlier works. Klochkov et al. (2008a) detected a Gaussian absorption line at ∼63.6 keV between the main and secondary peaks, corresponding to a phase bin of 0.4−0.5 in our study. This could indicate the presence of a CRSF, which are sometimes detected at higher significance in correspondence of some specific pulse phases. However, no similar feature was detected in the 2021 outburst. During the 2006 giant outburst, a minimum value of the power-law photon index was observed around the main peak. The cutoff energy exhibited a slight shift with respect to the peak towards earlier pulse phases. In the 2021 outburst, the maximum of the power law photon index and the cutoff energy coincide with the main pulse (Fig. 10). During the 2022 outburst, the source was observed by IXPE, Insight-HXMT, and ART-XC across the 2−70 keV energy range, at a distance of 2.4 kpc. The observed source luminosity was ∼3 × 1036 erg s−1 (Malacaria et al. 2023, Table 2). Additionally, they reported a maximum value of the photon index around the same peak in the phase-resolved results (Malacaria et al. 2023, Fig. 7). We emphasize that the peak luminosity of the 2006 outburst was reported as ∼1.1 × 1038 erg s−1 assuming d = 7.1 kpc (corresponding to ∼1.3 × 1037 erg s−1 if d = 2.4 kpc) from Klochkov et al. (2008a), as observed with INTEGRAL JEM-X in the 2−9 keV energy range. In contrast, our peak luminosity for the 2021 outburst is ∼1.45 × 1037 erg s−1, measured across the 0.01−150 keV range. The 2006 outburst’s luminosity would likely appear greater if observed across a broader energy range. As observed by Swift/BAT3, the flux of the 2006 outburst was 1.2 Crab, while the 2021 outburst flux was 0.6 Crab, indicating it was half as bright as the 2006 outburst. The contrasting phase-resolved results could be attributed to differences in luminosities.
5. Conclusions
We performed a comprehensive timing and spectral study of Be/X-ray binary EXO 2030+375. The pulse profiles exhibit strong energy and luminosity dependence, implying that changes are taking place in the geometry of emitting region. The hardness-intensity diagrams (7−10 keV/4−7 keV) indicate transitions in state during the early and late phases of the outburst. These state transitions were aligned with the luminosity levels, where changes in the pulse profile shape occurred, indicating a critical luminosity of 1.1 × 1037 erg s−1; however, the spectral properties did not exhibit a clear transition throughout the outburst. Additionally, no clear evidence of CRSFs was found in the phase-averaged and phase-resolved spectra during the outburst. Future detection of CRSFs in EXO 2030+375 could significantly enhance our understanding of the pulsar’s magnetic field structure and its evolution during outbursts, as well as provide crucial insights for determining its critical luminosity.
The MAXI data were retrieved from http://maxi.riken.jp/star_data/J2032+376/J2032+376.html
Acknowledgments
This work made use of data from the Insight-HXMT mission, a project funded by China National Space Administration (CNSA) and the Chinese Academy of Sciences (CAS). Y.J. Du would like to thank the support from China Scholarship Council (CSC 202108080247). P.J. Wang is grateful for the financial support provided by the Sino-German (CSC-DAAD) Postdoc Scholarship Program (57678375). L.D. Kong is grateful for the financial support provided by the Sino-German (CSC-DAAD) Postdoc Scholarship Program (57607866). L. Ji is supported by the National Natural Science Foundation of China under grant No. 12173103. LD acknowledges funding from the Deutsche Forschungsgemeinschaft (DFG, German Research Foundation) – Projektnummer 549824807.
References
- Arnaud, K. A. 1996, ASP Conf. Ser., 101, 17 [Google Scholar]
- Bailer-Jones, C. A. L., Rybizki, J., Fouesneau, M., et al. 2021, AJ, 161, 147 [NASA ADS] [CrossRef] [Google Scholar]
- Ballhausen, R., Thalhammer, P., Pradhan, P., et al. 2024, A&A, 688, A214 [NASA ADS] [CrossRef] [EDP Sciences] [Google Scholar]
- Basko, M. M., & Sunyaev, R. A. 1976, MNRAS, 175, 395 [Google Scholar]
- Becker, P. A., Klochkov, D., Schönherr, G., et al. 2012, A&A, 544, A123 [NASA ADS] [CrossRef] [EDP Sciences] [Google Scholar]
- Cao, X., Jiang, W., Meng, B., et al. 2020, Sci. China Phys. Mech. Astron., 63, 249504 [NASA ADS] [CrossRef] [Google Scholar]
- Ferrigno, C., Pjanka, P., Bozzo, E., et al. 2016, XMM-Newton: The Next Decade, 44 [Google Scholar]
- Fu, Y.-C., Song, L. M., Ding, G. Q., et al. 2023, MNRAS, 521, 893 [CrossRef] [Google Scholar]
- Hou, X., Ge, M. Y., Ji, L., et al. 2022, ApJ, 938, 149 [NASA ADS] [CrossRef] [Google Scholar]
- Ji, L., Doroshenko, V., Santangelo, A., et al. 2020, MNRAS, 491, 1851 [NASA ADS] [Google Scholar]
- Klochkov, D., Horns, D., Santangelo, A., et al. 2007, A&A, 464, L45 [NASA ADS] [CrossRef] [EDP Sciences] [Google Scholar]
- Klochkov, D., Santangelo, A., Staubert, R., et al. 2008a, A&A, 491, 833 [NASA ADS] [CrossRef] [EDP Sciences] [Google Scholar]
- Klochkov, D., Staubert, R., Postnov, K., et al. 2008b, A&A, 482, 907 [NASA ADS] [CrossRef] [EDP Sciences] [Google Scholar]
- Kong, L. D., Zhang, S., Chen, Y. P., et al. 2020, ApJ, 902, 18 [NASA ADS] [CrossRef] [Google Scholar]
- Leahy, D. A. 1987, A&A, 180, 275 [NASA ADS] [Google Scholar]
- Li, X., Li, X., Tan, Y., et al. 2020, J. High Energy Astrophys., 27, 64 [NASA ADS] [CrossRef] [Google Scholar]
- Liao, J.-Y., Zhang, S., Lu, X.-F., et al. 2020, J. High Energy Astrophys., 27, 14 [NASA ADS] [CrossRef] [Google Scholar]
- Liu, C., Zhang, Y., Li, X., et al. 2020, Sci. China Phys. Mech. Astron., 63, 249503 [NASA ADS] [CrossRef] [Google Scholar]
- Lutovinov, A. A., & Tsygankov, S. S. 2009, Astron. Lett., 35, 433 [NASA ADS] [CrossRef] [Google Scholar]
- Lutovinov, A. A., Tsygankov, S. S., Suleimanov, V. F., et al. 2015, MNRAS, 448, 2175 [NASA ADS] [CrossRef] [Google Scholar]
- Malacaria, C., Heyl, J., Doroshenko, V., et al. 2023, A&A, 675, A29 [NASA ADS] [CrossRef] [EDP Sciences] [Google Scholar]
- Maraschi, L., Treves, A., & van den Heuvel, E. P. J. 1976, Nature, 259, 292 [CrossRef] [Google Scholar]
- Maitra, C., & Paul, B. 2013, ApJ, 763, 79 [NASA ADS] [CrossRef] [Google Scholar]
- Matsuoka, M., Kawasaki, K., Ueno, S., et al. 2009, PASJ, 61, 999 [Google Scholar]
- Mushtukov, A., & Tsygankov, S. 2023, Handbook of X-ray and Gamma-ray Astrophysics, 138 [Google Scholar]
- Mushtukov, A. A., Suleimanov, V. F., Tsygankov, S. S., et al. 2015, MNRAS, 447, 1847 [NASA ADS] [CrossRef] [Google Scholar]
- Parmar, A. N., Stella, L., Ferri, P., et al. 1985, IAU Circ., 4066, 1 [NASA ADS] [Google Scholar]
- Parmar, A. N., White, N. E., Stella, L., et al. 1989, ApJ, 338, 359 [NASA ADS] [CrossRef] [Google Scholar]
- Reig, P. 2011, Ap&SS, 332, 1 [Google Scholar]
- Reig, P., & Coe, M. J. 1999, MNRAS, 302, 700 [CrossRef] [Google Scholar]
- Reig, P., & Nespoli, E. 2013, A&A, 551, A1 [NASA ADS] [CrossRef] [EDP Sciences] [Google Scholar]
- Staubert, R., Trümper, J., Kendziorra, E., et al. 2019, A&A, 622, A61 [NASA ADS] [CrossRef] [EDP Sciences] [Google Scholar]
- Thalhammer, P., Ballhausen, R., Sokolova-Lapa, E., et al. 2024, A&A, 688, A213 [NASA ADS] [CrossRef] [EDP Sciences] [Google Scholar]
- Tsygankov, S. S., Doroshenko, V., Mushtukov, A. A., et al. 2018, MNRAS, 479, L134 [CrossRef] [Google Scholar]
- Wang, P. J., Kong, L. D., Zhang, S., et al. 2022, ApJ, 935, 125 [NASA ADS] [CrossRef] [Google Scholar]
- Wilms, J., Allen, A., & McCray, R. 2000, ApJ, 542, 914 [Google Scholar]
- Zhang, S.-N., Li, T., Lu, F., et al. 2020, Sci. China Phys. Mech. Astron., 63, 249502 [NASA ADS] [CrossRef] [Google Scholar]
Appendix A: Observations
Insight-HXMT observations of EXO 2030+375 during the 2021 outburst used for data analysis.
Appendix B: Pulse-on and pulse-off spectral analysis
We wish to highlight our decision to restrict the energy range to 2−50 keV for the spectral analysis, aiming to focus on an energy range with reliable background calibration. Initially, we analyzed data ranging from 2−100 keV. As illustrated in Fig B.1, the asterisk marks denote the background values for ObsID P030403002703. The characteristic "U-shaped" background (see in (Liao et al. 2020) for the description of the background model) observed between 40 keV and 50 keV, may be responsible for the feature seen around 47 keV. For a more thorough investigation of the feature, we performed pulse-on and pulse-off spectrum analysis for ObsID P030403002703. This analysis involves comparing the X-ray spectra at different phases of the pulsar’s rotation, specifically when the pulsar’s emission is strongest (pulse-on) and weakest (pulse-off). By using the spectrum from the weakest phase as the background, this method helps avoid the influence of an excessively high background, which can otherwise obscure the true emission features. The phase bin extracted for the pulse-on spectrum covered phases 0.5-0.7 (mostly encompassing the main peak), while the phase bin for the pulse-off spectrum covered phases 0.97-1.03 (centered on the lowest flux). As seen in Fig B.2, we did not observe the 47 keV feature and the background is significant above 50 keV. Therefore, we restricted the energy range to 2−50 keV in this paper to minimize uncertainties associated with background.
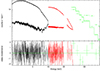 |
Fig. B.1. Broadband spectrum of EXO 2030+375 (ObsID: P030403002703) in energy range 2−100 keV using the model const×tbabs(gauss+bbodyrad+gauss+cutoffpl). The asterisk marks represent background values, the solid crosses represent net spectral values, and the step line indicates the model. |
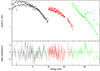 |
Fig. B.2. Pulse-on minus pulse-off spectrum of ObsID P03040300270 in the energy range 2–100 keV using the model const×tbabs×cutoffpl. |
All Tables
Best-fit parameters of the phase-averaged broadband spectrum of EXO 2030+375 as observed by Insight-HXMT at the maximum of the outburst using the model const×tbabs(gauss+bbodyrad+gauss+cutoffpl) in the 2−50 keV energy band.
Insight-HXMT observations of EXO 2030+375 during the 2021 outburst used for data analysis.
All Figures
|
Fig. 1. Light curve of EXO 2030+375 as measured by MAXI (2−20 keV), with data binned over one orbital revolution of the International Space Station, where MAXI is mounted (∼1.5 hours), shown in the first panel. The second panel shows the light curve from the Insight-HXMT observations during the 2021 giant outburst. Each point represents the daily-averaged luminosity (0.01−150 keV), derived through spectral fitting of the Insight-HXMT data. |
| In the text | |
|
Fig. 2. 2D maps describe the evolution of the pulse profile with time observed by Insight-HXMT during the 2021 outburst (proposal P0304030 and P0404147, MJD 59427−59535). Top: 1−10 keV; middle: 10−30 keV; and bottom: 25−100 keV. The black points in the figure represent the luminosity (0.01−150 keV). |
| In the text | |
|
Fig. 3. Energy-resolved pulse profiles of EXO 2030+375 near the maximum of the outburst. |
| In the text | |
|
Fig. 4. Variation in the PF with energy (keV). Rise: P0304030016, L ∼ 1.16 × 1037 erg s−1. Peak: P0404147, and L ∼ 1.40 × 1037 erg s−1. Decay: P0304030060, L ∼ 5.56 × 1036 erg s−1. |
| In the text | |
|
Fig. 5. Variation in pulse fraction with luminosity in 25−100 keV energy range during the 2021 outburst. Black crosses represent the rise of the outburst, blue the decay. |
| In the text | |
|
Fig. 6. Net light curves and hardness of EXO 2030+375 of all observations from MJD 59427 to MID 59535. The hardness is defined as the ratio 7−10 keV/4−7 keV. Each point corresponds to the data of one day. The evolution of hardness over time is represented by dividing it into four distinct periods, each indicated by a different color: blue (MJD 59427 to 59438), green (MJD 59438 to 59473), orange (MJD 59473 to 59508), and red (MJD 59508 to 59535). |
| In the text | |
|
Fig. 7. HID extracted from Insight- HXMT/LE data. Hardness is defined as the ratio 7−10 keV/4−7 keV. The colors are described in the same way as in Figure 6. |
| In the text | |
|
Fig. 8. Broadband spectrum of EXO 2030+375 at the peak of the 2021 giant outburst in energy range 2−50 keV using the model const×tbabs(gauss+bbodyrad+gauss+cutoffpl). (a) unfolded spectrum; (b) residuals for the best-fit model; (c) residuals after fitting without the blackbody component; and (d) residuals after fitting without the feature around 5.7 keV. |
| In the text | |
|
Fig. 9. Flux-resolved parameters using all the observations of the 2021 giant outburst in energy range 2−50 keV. |
| In the text | |
|
Fig. 10. Modulation of phase-resolved parameters observed by Insight-HXMT. Rise: MJD 59436−59438, L ∼ 1.0 × 1037 erg s−1; peak: 59460−59461 MJD, L ∼ 1.45 × 1037 erg s−1; decay: 59529−59533 MJD, L ∼ 0.4 × 1037 erg s−1. For each of the three subfigures, the panels (from top to bottom) show the pulse profile (1−10 keV), the column density (NH), the power-law photon index (Γ), and the cutoff energy (Ecut). |
| In the text | |
|
Fig. B.1. Broadband spectrum of EXO 2030+375 (ObsID: P030403002703) in energy range 2−100 keV using the model const×tbabs(gauss+bbodyrad+gauss+cutoffpl). The asterisk marks represent background values, the solid crosses represent net spectral values, and the step line indicates the model. |
| In the text | |
|
Fig. B.2. Pulse-on minus pulse-off spectrum of ObsID P03040300270 in the energy range 2–100 keV using the model const×tbabs×cutoffpl. |
| In the text | |
Current usage metrics show cumulative count of Article Views (full-text article views including HTML views, PDF and ePub downloads, according to the available data) and Abstracts Views on Vision4Press platform.
Data correspond to usage on the plateform after 2015. The current usage metrics is available 48-96 hours after online publication and is updated daily on week days.
Initial download of the metrics may take a while.