| Issue |
A&A
Volume 689, September 2024
|
|
|---|---|---|
| Article Number | A316 | |
| Number of page(s) | 11 | |
| Section | Astrophysical processes | |
| DOI | https://doi.org/10.1051/0004-6361/202450149 | |
| Published online | 23 September 2024 | |
Spectral evolution of RX J0440.9+4431 during the 2022–2023 giant outburst observed with Insight-HXMT
1
Key Laboratory of Particle Astrophysics, Institute of High Energy Physics, Chinese Academy of Sciences, Beijing 100049, China
e-mail: This email address is being protected from spambots. You need JavaScript enabled to view it.
2
University of Chinese Academy of Sciences, Chinese Academy of Sciences, Beijing 100049, China
3
Department of Physics and Astronomy, George Mason University, Fairfax, VA 22030-4444, USA
Received:
27
March
2024
Accepted:
19
June
2024
Abstract
In 2022–2023, the Be/X-ray binary X-ray pulsar RX J0440.9+4431 underwent a Type II giant outburst, reaching a peak luminosity of LX ∼ × 1037 erg s−1. In this work, we utilized Insight-HXMT data to analyze the spectral evolution of RX J0440.9+4431 during the giant outburst. By analyzing the variation in the X-ray spectrum during the outburst using standard phenomenological models, we find that as the luminosity approaches the critical luminosity, the spectrum becomes flatter, with the photon enhancement predominantly concentrated around ∼2 keV and 20–40 keV. The same behavior has also been noted in Type II outbursts from other sources. While the phenomenological models provide good fits to the spectrum, it is sometimes difficult to gain insight into details of the fundamental accretion physics using this approach. Hence, we also analyzed spectra obtained during high and low phases of the outburst using a new, recently developed physics-based theoretical model that allows us to study the variations in the physical parameters during the outburst, such as the temperature, density, and magnetic field strength. Application of the theoretical model reveals that the observed spectrum is dominated by Comptonized bremsstrahlung emission emitted from the column walls in both the high and low states. We show that the spectral flattening observed at high luminosities results from a decrease in the electron temperature, combined with a compactification of the emission zone, which reduces the efficiency of bulk Comptonization. We also demonstrate that when the source is at maximum luminosity, the spectrum tends to harden around the peak of the pulse profile, and we discuss possible theoretical explanations for this behavior. We argue that the totality of the behavior in this source can be explained if the accretion column is in a quasi-critical state at the time of maximum luminosity during the outburst.
Key words: stars: neutron / pulsars: general / pulsars: individual: RX J0440.9+4431 / X-rays: bursts / X-rays: stars
Corresponding author; This email address is being protected from spambots. You need JavaScript enabled to view it. .
© The Authors 2024
 Open Access article, published by EDP Sciences, under the terms of the Creative Commons Attribution License (https://creativecommons.org/licenses/by/4.0), which permits unrestricted use, distribution, and reproduction in any medium, provided the original work is properly cited.
This article is published in open access under the Subscribe to Open model. This email address is being protected from spambots. You need JavaScript enabled to view it. to support open access publication.
1. Introduction
X-ray pulsars (XRPs) are a class of accreting, strongly magnetized (B ≳ 1012 G) neutron stars (NSs) located in binary systems, and are typically accompanied by massive optical companions (see the reviews by Harding & Lai 2006; Mushtukov & Tsygankov 2022). Plasma material from the optical companion can be accreted onto the compact object through various mechanisms, including stellar winds, accretion disks, or some combination of processes. When the accreting material approaches the NS at a certain distance, its flow is disrupted by the strong magnetic field, forming a boundary at the NS magnetosphere (Belenkaya et al. 2015). Due to various instabilities near the magnetosphere radius (Spruit & Taam 1993), material enters the magnetosphere and travels along magnetic field lines to reach a small region on the stellar surface surrounding the magnetic pole, with radius ~104 − 5 cm (e.g., Harding et al. 1984). The kinetic energy of the accreting gas (derived from its gravitational potential energy) is ultimately radiated away in the form of X-rays (Basko & Sunyaev 1976).
The observed luminosities of XRPs span an extremely wide range, covering ∼9 orders of magnitude, from LX ∼ 1032 erg s−1 to LX ∼ 1041 erg s−1 (e.g., Rouco Escorial et al. 2017; Lutovinov et al. 2021; Kong et al. 2020). In the low-luminosity sources, the accreting matter passes through a gas-mediated, discontinuous shock at the top of the accretion column, with the subsequent final deceleration occurring via Coulomb collisions near the stellar surface (Langer & Rappaport 1982). Conversely, in the high-luminosity sources, the accreting material passes through an extended, radiation-dominated shock. In this situation, the gas decelerates smoothly through the sonic point under the influence of radiation pressure (Wang & Frank 1981; Davidson 1973).
The spectra of XRPs have typically been fitted using products of power laws and exponential cutoffs (e.g., White et al. 1983). The exponential cutoff is interpreted physically as the onset of collisional Compton recoil losses for photons with energy ϵ ≳ kTe scattering off electrons with temperature Te. This interpretation has motivated the wide adoption of the cutoffpl model in XSPEC1 by researchers fitting the spectral continua of XRPs. Other similar simplified models have subsequently been used to fit the continuum emission from XRPs, such as the models NPEX (Mihara et al. 1995) and powerlaw × highecut (Coburn et al. 2002).
In the fitting of XRP spectra, one or more extra blackbody components (bbodyrad) are sometimes needed to account for the soft emission in the spectra. Under low-luminosity conditions, only one bbodyrad typically needs to be included in the fitting. This is often interpreted as the cooling of an accretion-heated NS crust in the propeller state (Tsygankov et al. 2016a) or as thermal radiation originating from the hot spot at the base of the accretion column (Tsygankov et al. 2016b; Gorban et al. 2021). However, in the case of luminous XRPs (LX ≳ 1038 erg s−1), such as 1A 0535+262 (Kong et al. 2021) and SXP 59 (Weng et al. 2019), two blackbody components are often needed – one with a high temperature and another with a low temperature. The high-temperature blackbody, reaching up to 4 keV with a radius of ∼1 km, is often linked to the accretion column. The lower-temperature blackbody is considered to be associated with the accretion disk or accretion curtain. Nevertheless, these methods are still relatively phenomenological and therefore it is challenging to relate them to the detailed physical processes occurring in XRP accretion columns. Hence, most current research primarily focuses on the evolution of spectral parameters (Kong et al. 2020; Tamang et al. 2022; Mandal et al. 2023). There are also clear indications of cyclotron features and iron emission lines in the observed spectra (e.g., Jaisawal et al. 2019; Tamang et al. 2024).
Due to the extremely strong magnetic fields and gravity, as well as the high-temperature environment in XRPs, the radiative transfer in the accreting gas is quite complex, and it has therefore proven very challenging to simulate the physical processes occurring in these sources using theoretical models. Currently, there is no widely accepted, fully self-consistent physical model to describe the observed spectra of these objects across a wide range of mass accretion rates, because of the strong coupling between the radiative transfer and the radiation hydrodynamics that determines the physical structure of the accretion column. However, significant progress on the development of theoretical models for the calculation of XRP spectra has been made in recent years, which we briefly review below.
In the case of high-luminosity XRPs, Becker & Wolff (2007, hereafter BW07) incorporated both bulk and thermal Comptonization in their theoretical model describing the X-ray spectral formation process in XRPs. They presented an analytical derivation of Green’s function for the problem and proceeded to convolve Green’s function with source terms corresponding to bremsstrahlung, cyclotron, and blackbody emission to compute emergent spectra. This approach was successfully applied to explain the phase-averaged X-ray spectra for sources such as Her X-1, Cen X-3, and LMC X-4. Later, Farinelli et al. (2012) adjusted the velocity profile of the accreting material based on the BW07 model and developed a compmag model for the X-ray spectral fitting software package XSPEC. However, these models have limitations when fitting data from low-luminosity sources because they only consider photon escape through the walls of the accretion column.
Recently, Becker & Wolff (2022, hereafter BW22) expanded upon BW07, addressing aspects such as the geometry of the accretion column, the calculation of separate top and wall components for the escaping radiation beam, and incorporating a realistic velocity profile. In particular, their model can be used to analyze spectra from XRPs over a very wide range of luminosity, which they demonstrated by successfully fitting the spectra of both the high-luminosity source Her X-1 and the low-luminosity source X Per using the same model. However, further scrutiny through additional spectral data is still required to provide a solid theoretical foundation for understanding the formation of X-ray spectra emitted by XRPs. Because the BW22 model can accommodate a wide range of accretion rates, it is ideally suited for the analysis of the spectral evolution observed during Type II X-ray outbursts from XRPs. Hence, one of the primary goals of this paper is to use the new BW22 model to analyze observations obtained during two portions of the giant outburst from RX J0440.9+4431 between January and March 2023, in which the source luminosity exhibited significant variation.
2. Source properties
RX J0440.9+4431 is a Be/X-ray binary (BeXRB) system (see the review by Reig 2011). In 2022–2023, RX J0440.9+4431 underwent a first-ever giant outburst (Nakajima et al. 2022; Pal et al. 2023; Coley et al. 2023), reaching a peak luminosity LX ∼ × 1037 erg s−1. Prior to the giant outburst, the system had undergone three smaller outbursts in March 2010 (Morii et al. 2010), September 2010 (Krivonos et al. 2010), and January 2011 (Tsygankov et al. 2011), but the luminosity during these events was LX < 1037 erg s−1. The X-ray spectrum of RX J0440.9+4431 has generally been characterized by fitting the data using typical phenomenological models, based on simple mathematical functions such as power laws and exponential cutoffs. For example, Usui et al. (2012) analyzed the phase-averaged spectrum of the first outburst of RX J0440.9+4431 observed by RXTE. They found that the spectrum was well fitted using a power-law model modified with an exponential cut-off, plus a blackbody component with a temperature of ∼2 keV, and an additional Gaussian function representing an iron emission line. Subsequently, Tsygankov et al. (2012) conducted an analysis of the spectrum of RX J0440.9+4431 obtained during the September 2010 outburst using data from INTEGRAL, Swift, and RXTE. They reported the discovery of a ∼32 keV cyclotron resonant scattering feature (CRSF). However, Ferrigno et al. (2013) reanalyzed the data and explored different models (bmc and compmag). Their conclusion was that the absorption feature reported by Tsygankov et al. (2012) was likely a result of systematic biases in the joint analysis of data from multiple instruments and/or an inadequate modeling of the continuum emission.
Simple phenomenological models are often difficult to translate into physical variables such as temperature, density, and magnetic field strength. This has motivated attempts to gain additional insight via the fitting of physics-based models. For example, Salganik et al. (2023) conducted a detailed study of the spectra based on observations from NuSTAR, INTEGRAL, and NICER. The broadband energy spectrum of RX J0440.9+4431 in its bright state was well described by a two-hump model (comptt+comptt) with peaks at energies around 10–20 keV and 50–70 keV, without any observed photon deficit around 30 keV. The high-energy component in it may be caused by multiple Compton scattering of cyclotron seed photons in the NS atmosphere. Additionally, Mandal et al. (2023) used NICER data to analyze the evolution of continuum spectral parameters and iron line parameters for this source.
In this work, we utilized data from Insight-HXMT, which covers a broader energy range than NICER, to analyze the spectral evolution of RX J0440.9+4431 during the giant outburst in 2022–2023. The observations and data reduction procedures are presented in Sect. 3. Based on phenomenological fits, we find that as the luminosity approached the critical luminosity, the spectrum became flatter, with photon enhancement predominantly concentrated around ∼2 keV and 20–40 keV. To gain additional physical insight, beyond what can be obtained using the phenomenological models, in Sect. 4 we analyze the spectral data obtained during high and low luminosity phases of the giant outburst using the physics-based BW22 model. Finally, in Sect. 5 we discuss our principle findings and conclusions.
3. Observations and data reduction
Insight-HXMT is China’s first space astronomical satellite, equipped with three payloads capable of covering a total energy range of 1–250 keV (Zhang et al. 2020). These payloads include low energy (LE) detectors (1–15 keV) with an area of 384 cm2 (Chen et al. 2020), medium energy (ME) detectors (5–30 keV) with an area of 952 cm2 (Cao et al. 2020), and high energy (HE) detectors (20–250 keV) with an area of 5100 cm2 (Liu et al. 2020). Since its launch in 2017, many interesting results regarding accreting pulsars have been reported (e.g., Wang et al. 2022; Hou et al. 2022; Fu et al. 2023).
Following the X-ray outburst of RX J0440.9+4431, which was triggered by MAXI, Insight-HXMT conducted intensive observations for nearly three months, from MJD 59944 to 60029. These observations covered various phases of the outburst, including the rise, the outburst peak, and the full decay phase. The ObsIDs used in this study have been provided in the article on the timing analysis of RX J0440.9+4431 (Li et al. 2023). All of the observations studied here were analyzed using the Insight-HXMT processing software HXMTDAS v2.052, following standard processing procedures3. The energy ranges selected were 2–10 keV (LE), 10–30 keV (ME), and 30–120 keV (HE). To improve the counting statistics of the spectra, we utilized the ftool grppha. For the LE data, channels 0–579 are binned up by a factor of 2, and channels 580–1535 are binned up by a factor of 10. For the ME data, channels 0–1024 are binned up by a factor of 2. Similarly, for the HE data, channels 0–255 are binned up by a factor of 2. The spectral data were analyzed using XSPEC v12.12.1, with a system error set to 1% for the HE range.
4. Analysis and results
Hardness-intensity diagrams (HIDs) are a very useful tool that allows one to investigate spectral changes without assuming any spectral model. Following the approach of Reig (2008) and Reig & Nespoli (2013), we present in Fig. 1 the count rate (4–10 keV) as a function of the soft color (SC; 7–10 keV/4–7 keV) using Insight-HXMT/LE, and also the count rate (10–30 keV) as a function of the hard color (HC; 15–30 keV/10–15 keV) using Insight-HXMT/ME. Figure 1 is consistent with the HID of RX J0440.9+4431 obtained by Salganik et al. (2023) and Mandal et al. (2023) using NICER data. The plot of the SC in the left-hand panel of Fig. 1 exhibits two branches. Along the low-intensity branch, the SC is directly proportional to the count rate, but along the high-intensity branch, the SC is inversely proportional to the count rate, indicating a significant increase in low-energy photons with increasing luminosity. We note that the high-intensity branch in the SC plot is similar to the diagonal branch discussed by Reig & Nespoli (2013), which they interpret as indicative of a super-critical luminosity. However, the high-intensity branch in the SC plot in Fig. 1 is shorter, perhaps suggesting that the luminosity is quasi-critical rather than super-critical. The HC for RX J0440.9+4431, plotted in the right-hand panel of Fig. 1, does not exhibit branches; instead, it shows that the HC is directly proportional to the count rate throughout the entire outburst.
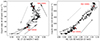 |
Fig. 1. Hardness-intensity diagram (HID) of the RX J0440.9+4431 2022–2023 giant outburst observed with Insight-HXMT. The arrows show the direction of the evolution. The black and gray colors represent the rising and declining parts of the outburst, respectively. The red stars indicate the representative low and high state data used for the spectral fits. |
The combination of the SC and HC variation plotted in Fig. 1 suggests that a complex spectral evolution is occurring during the Type II outburst studied here. To better visualize the spectral evolution of RX J0440.9+4431 during the outburst, in the left-hand panel of Fig. 2 we plot the spectral evolution, using the first observation (ObsID P0514361001) as a reference and normalizing the other data to this reference. We note that as the luminosity increases, the increase in the emission is mainly concentrated around ∼2 keV and ∼20–40 keV. To determine whether the increase in photons is phase-dependent, we accumulated the phase-resolved spectra into eight pulse-phase bins from ObsID P0514361040, corresponding to the high state. Each phase-resolved spectrum is also normalized by the reference spectrum (ObsID P0514361001). The resulting pulse profile, plotted in the right-hand panel of Fig. 2, indicates that the observed spectrum becomes significantly harder at the peak of the pulse profile. This issue is further discussed from a theoretical perspective in Sect. 5.
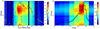 |
Fig. 2. Spectral evolution observed during the 2022–2023 giant outburst. Left panel: spectral evolution and pulse profile of RX J0440.9+4431 during the outburst, based on Insight-HXMT data. The color bar signifies flux intensity, with dark blue denoting periods without observations. White dots represent X-ray luminosity in the 0.3–120 keV energy range, aligned with the right y-axis. Two dashed-dotted lines (MJD 59948; MJD 59981) indicate the positions of ObsID P0514361005 (low state) and ObsID P0514361040 (high state), respectively. Right panel: evolution of the energy ratio over phase from ObsID P0514361040. The solid black line represents the pulse profile for 70–100 keV (Li et al. 2023), corresponding to the right y-axis. |
4.1. Phenomenological model
Initially, we analyzed the variable spectrum of RX J0440.9+4431 using the commonly used model, cutoffpl+bbodyrad, and included a gaussian to describe the iron emission line at 6.4 keV. Considering the interstellar absorption, we applied TBabs to these three components. The hydrogen column density, NH, was fixed at 0.6 × 1022 cm−2, which is estimated based on the Galactic H I density in the direction of RX J0440.9+4431 (HI4PI Collaboration 2016). Abundances were set to WILM (Wilms et al. 2000), and cross sections to VERN (Verner et al. 1996). Additionally, constant was included to account for the normalization discrepancy between different telescopes, with the factor fixed at 1 for LE and free for ME and HE. Due to the uncertain calibration of an Ag emission line, we ignored the 20–23 keV energy range in the ME. Taking ObsID P0514361005 as an example of the low-luminosity state, the model 1 (const×TBabs×(cutoffpl+bbodyrad+gaussian)) provides a good fit at low luminosities (χ2 = 353 for 293 degrees of freedom). The inclusion of blackbody components in the spectral fitting process is generally thought to reflect thermal emission from the magnetic pole hot spots, the optically thick accretion curtain, and/or the accretion disk. The detailed results are shown in Fig. 3 and Table 1.
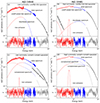 |
Fig. 3. Unfolded spectra, phenomenological model components, and spectral residuals for Insight-HXMT observations (red for LE; blue for ME; black for HE) of RX J0440.9+4431 with model 1 and model 2. |
Best-fitting spectral parameters of the Insight-HXMT observations of RX J0440.9+4431 using model 1 and model 2. Uncertainties are given at 90%.
As the luminosity reaches the highest value observed during the outburst studied here, we find that significant spectral changes occur, as shown in Fig. 2. In particular, we require an extra bbodyrad component in order to obtain an acceptable fit. Here, we select ObsID P0514361040 as an example of the high-luminosity state. In this state, we find that one blackbody has a lower temperature at 0.37 ± 0.04 keV, with an emitting region radius of 10–19 km calculated using Nbb = (Rbb/D10)2, where D10 represents the source distance in units of 10 kpc and Rbb is the radius of the blackbody. The other blackbody, however, has a temperature as high as  keV, corresponding to an emitting region of 0.14–0.16 km. Similar features have been observed in the spectral fitting results of several sources, such as 1A 0535+262 (Mandal & Pal 2022), Swift J0243.6+6124 (Tao et al. 2019), SXP 59 (Weng et al. 2019).
In the high state, the emission of a cold blackbody component with a radius of 10–19 km may be related to the optically thick accretion curtain, while this hot blackbody component is not typical for Be/X-ray systems (Hickox et al. 2004). Theoretically, due to the accretion column, we cannot directly receive emission from the hotspot at high brightness. Hence, Salganik et al. (2023) used two comptt models to fit the spectrum of RX J0440.9+4431. Following his approach, we also employed model 2 (const×TBabs×(comptt+comptt+gaussian)) to fit the low and high luminosity states separately, as shown in Fig. 3 and Table 1. The optical depth in the high state is significantly increased compared to that in the low state, which results in a flatter spectrum. Both model 2 and model 1 describe the spectra well, as anticipated due to their numerous parameters offering flexibility. Yet, these parameters fall short of elucidating the fundamental physical processes.
4.2. Fitting using the BW22 model
The model 1 fitting procedure described in Sect. 4.1 is phenomenological in nature, meaning that generic functional forms are fitted, including free parameters that do not necessarily have a direct correspondence to the physical properties of the source. The application of model 2 was an improvement because the comptt component includes a physical temperature. However, even in the case of model 2, there is no specification of an overarching physical context. We therefore decided that it would also be interesting to analyze the data using the model of BW22, which is designed to simulate the spectral formation process in XRPs over a wide range of accretion rates. This makes it especially useful for analyzing the outburst spectra for RX J0440.9+4431 in two different luminosity states. The BW22 model provides a complete description of the spectral formation processes occurring in a conical accretion column located over one of the magnetic poles of an accreting NS, and it includes a more realistic velocity profile than that assumed by BW07. We briefly review the key elements of the BW22 model below.
The BW22 model is a generalization of the original BW07 model in several respects. These includes the adoption of a conical geometry for the column, which is more appropriate than the cylindrical geometry of the BW07 model. Furthermore, the BW22 model also incorporates a more realistic velocity profile that merges smoothly with the Newtonian free-fall profile far from the NS. The velocity profiles also incorporates a variable impact velocity, in order to treat cases in the which the accretion rate is subcritical, and hence radiation pressure is insufficient to decelerate the gas to rest at the stellar surface. In these instances, the final merger with the stellar crust is accomplished via Coulomb deceleration rather than deceleration via the radiation pressure gradient. The BW22 model also includes the possibility of radiation escape through the walls or top of the accretion column, hence facilitating the computation of “fan” and “pencil” beam components to the escaping radiation field, respectively. In the BW22 model, the escape of radiation through the top of the column is treated via the adoption of a free-streaming upper boundary condition. When the accretion rate is super-critical, the deceleration of the gas occurs due to passage through a radiative, radiation-dominated shock wave.
In contrast with a gas-mediated shock, in which the velocity profile exhibits a discontinuity, in a radiation-dominated shock, there is no such discontinuity, and instead the flow velocity decreases smoothly through the sonic point, and the thickness of the shock in this case is about one mean free path for electron scattering (Blandford & Payne 1981). When the radiation-dominated shock is “adiabatic”, meaning that the total energy flux is conserved, the jump conditions have the standard Rankine-Hugoniot form for a gas with adiabatic index γ = 4/3, and the velocity decreases by a factor of 7 if the shock is strong (Blandford & Payne 1981). However, in an XRP accretion column, the shock is radiative in nature, meaning that the total energy flux is not conserved. This is the case treated by BW07 and BW22. In this situation, the kinetic energy is radiated away via photons escaping through the column walls, and the flow essentially comes to rest at the stellar surface (Wang & Frank 1981; Basko & Sunyaev 1976; Becker 1998). Hence, when radiation escape is taken into account, the compression ratio can be much larger than the factor of 7 obtained in a strong, adiabatic radiation-dominated shock. We note that the smooth, extended region of deceleration in the BW22 model is qualitatively quite similar to that obtained by Zhang et al. (2022) in their two-dimensional simulations.
Assuming that the source is emitting isotropically at a distance D = 2.4 kpc, we find that the observed X-ray fluxes in the high (ObsID P0514361040) and low (ObsID P0514361005) states correspond to luminosities LX = 3.44 × 1037 erg s−1 and LX = 9.23 × 1036 erg s−1, respectively. If all of the gravitational potential energy is released before the matter merges with the NS crust, and the matter starts out cold and with zero kinetic energy at infinity, then it follows that we can use energy conservation to relate the luminosity, LX, to the accretion rate, Ṁ, via
 (1)
(1)
where G denotes the gravitational constant. Adopting canonical values for the NS mass M* = 1.4 M⊙ and radius R* = 10 km, we obtain for the accretion rates in the high (ObsID P0514361040) and low (ObsID P0514361005) states Ṁ = 1.90 × 10¹⁷ g s−1 and Ṁ = 5.00 × 10¹⁶ g s−1, respectively.
In Fig. 4, we present the qualitative best fit results for the theoretical phase-averaged spectra obtained in the high and low states using the BW22 model, compared with the Insight-HXMT data. Individual curves are plotted representing the components of the observed spectrum due to Comptonized bremsstrahlung, cyclotron, and blackbody seed photons, escaping through either the walls or the top of the accretion column. Escape of photons through the top of the column is possible despite the large inflowing mass flux, because the electron scattering cross section for photons propagating parallel to the direction of the magnetic field is about five orders of magnitude smaller than the Thomson value (see Table 2). The values for the associated input theoretical parameters are listed in Table 3. We obtain the same value for the surface magnetic field strength in both states, B* = 1.07 × 10¹³ G, as required since this parameter should remain consistent during the outburst. This is consistent with the estimation by Li et al. (2024) of the magnetic field of RX J0440.9+4431. They considered that the break frequency equals the Keplerian frequency/dynamo frequency at the inner radius of the accretion disk. This value for B* is used when computing the contribution to the spectrum due to Comptonized cyclotron seed photons.
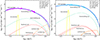 |
Fig. 4. Theoretical X-ray spectrum computed using the BW22 model, compared with Insight-HXMT data for RX J0440.9+443, during two epochs of the 2022–2023 giant outburst. The magenta points in the left panel refer to the low state (MJD 59948), with luminosity LX = 9.23 × 1036 erg s−1, and the cyan points in the right panel refer to the high state (MJD 59981), with luminosity LX = 3.44 × 1037 erg s−1. The theoretical spectral components computed using the BW22 model, corresponding to the reprocessing of bremsstrahlung, cyclotron, and blackbody seed photons escaping through the walls and top of the conical accretion column, are indicated. The solid blue curves denote the total spectra. |
Computed auxiliary theoretical parameters for the BW22 model.
The cyclotron and bremsstrahlung seed photons are generated throughout the accretion column, but they tend to be concentrated near the base of the column because the gas density is maximized there. The blackbody seed photons are emitted from the “hot spot” at the top of the thermal mound, which is located near the base of the accretion column. The spectra plotted in Fig. 4 indicate that in both the high and low states, the observed phase-averaged spectrum is dominated by Comptonized bremsstrahlung emission, escaping through the walls of the accretion column. The other spectral components make a negligible contribution to the observed spectrum, except the Comptonized cyclotron emission escaping through the column top, which slightly boosts the amplitude of the spectrum around ∼100 keV when the source is in the low state. We note that the effect of interstellar absorption was not included in the analysis as this is not expected to have a strong effect in the Insight-HXMT energy range.
Here, we are focusing on the simplest case, of the emission from a single magnetic pole, in order to determine how close we can get to the phase-averaged X-ray spectrum observed from RX J0440.9+4431 during the low and high states of the 2022–2023 giant outburst using the BW22 model. The consideration of emission from only one pole seems to be a reasonable first approach, since it is not clear a priori whether two poles actually contribute to the observed spectrum. Moreover, in order to consider the possible emission from two poles, one would need to employ a complete model for the geometry of the entire star, its rotation, and the alignment of the rotation axis with the line of sight from Earth, as well as specification of the angles between the rotation axis and the magnetic poles, which could be independent angles if the magnetic field is not exactly dipolar. This general problem is beyond the scope of the present paper, but we plan to consider it in future work.
The BW22 model is a physics-based analysis tool, and therefore the parameter values obtained using that model can be employed to study the variation in the accretion column structure during the high and low states of the outburst. The values obtained for the theoretical free parameters in the high and low states are reported in Table 3. We note that the electron temperature, Te, has distinctly different values in the high and low states, with Te = 1.19 × 10⁸ K in the high state and Te = 1.40 × 10⁸ K in the low state. The lower electron temperature in the high state results from an increase in the efficiency of bremsstrahlung cooling for larger values of the accretion rate. The parameter ψ, which determines the balance between thermal and bulk Comptonization (Becker & Wolff 2007), is also significantly different in the low and high states. In the low state, we find that ψ = 1.50, and in the high state we obtain ψ = 1.20. The lower value of ψ in the high state corresponds to an increase in the level of thermal Comptonization, which tends to increase the number of photons in the energy range ~10–20 keV, corresponding to ∼2 kTe. This effect, combined with the lowering of the electron temperature in the high state, may explain the observed flattening of the spectrum as the luminosity approaches the critical luminosity. The spectral flattening may also be connected with changes in the volume and location of the emission region, as discussed in Sect. 6.
Input theoretical parameters used for qualitatively fitting the BW22 model to the Insight-HXMT data for high and low states.
In addition to the temperature variation noted above, we also find that the radius of the conical accretion column at the stellar surface, r0, also varies significantly over the course of the outburst, with r0 = 22.7 m in the low state and r0 = 43.4 m in the high state. These values for the column radius at the stellar surface are comparable to the values obtained by Becker & Wolff (2007) and Wolff et al. (2016) in their models for Her X-1, which has a similar accretion rate to the source considered here (see also Harding et al. 1984). We interpret the difference between the high-state and low-state column radius as reflecting corresponding variations in the Alfvén radius, RA, which is the radius in the accretion disk where the accreting matter is redirected by the pulsar’s magnetic field (Lamb et al. 1973) into the stream that ultimately connects with the magnetic pole at the stellar surface. The Alfvén radius in the disk is computed by balancing the ram pressure of the accreting matter with the magnetic pressure in the dipole field. Within this radius, the fully ionized gas becomes entrained by the magnetic field, and it is constrained to follow the dipole field lines down to the stellar surface (Harding et al. 1984).
The evolution of the Alfvén radius during the outburst depends on the details of the complex interaction between the NS’s magnetosphere and the accretion disk, which are beyond the scope of the model considered here. However, we note that in general, we expect that in the high state, the greater accretion rate increases the ram pressure, which forces the accreting gas deeper into the dipole field before the field strength becomes large enough to balance the ram pressure of the gas. Hence, this effect tends to decrease RA and increase r0 going from the high to the low state, in agreement with the behavior observed here (Lamb et al. 1973).
The theoretical spectra plotted in Fig. 4 also include the effect of cyclotron absorption, with the shape of the CRSF simulated via multiplication by a Gaussian feature centered at the cyclotron energy, ϵc, and given by (e.g., Heindl & Chakrabarty 1999; Orlandini et al. 1998; Soong et al. 1990)
 (2)
(2)
where σc and dc represent the width and strength parameters, respectively, and ϵc denotes the cyclotron energy at the imprinting radius, rc, which is the radius where the effect of the CRSF absorption is concentrated. The value of ϵc is related to the field strength, Bc, at the imprinting radius rc via
 (3)
(3)
and the surface magnetic field strength, B*, is related to the CRSF imprinting radius field strength, Bc, via the dipole expression
 (4)
(4)
In addition to the input theoretical parameters listed in Table 3, we also computed several diagnostic output quantities using various theoretical relations from BW22, with values reported in Table 2. These quantities include the scattering cross sections for photons propagating parallel or perpendicular to the magnetic field, denoted by σ|| and σ⊥, respectively. The values obtained for the cyclotron absorption parameters are reported in Table 4. In the low state, we obtain Bc = 4.33 × 10¹² G, which implies an imprinting radius rc = 1.35 R*. Conversely, the value Bc = 5.19 × 10¹² G obtained in the high state implies an imprinting radius rc = 1.27 R*. These results indicate that the CRSF is imprinted at an altitude ~0.3 R* above the stellar surface, which is consistent with the findings of Ferrigno et al. (2011) in their study of 4U 0115+63, a source possessing a similar accretion rate to that of RX J0440.9+4431 during the 2022–2023 giant outburst. Furthermore, we note that the vertical extent of the emission region we find in RX J0440.9+4431 is comparable to that obtained by Zhang et al. (2022) and Sheng et al. (2023) in their two-dimensional simulations of the dynamics of sources with similar accretion rates.
Cyclotron absorption parameters for the BW22 model.
Comparing the high-state and low-state results for cyclotron imprinting radius, rc, indicates that the CRSF is formed at a lower altitude above the stellar surface in the high state as compared to the low state. This is consistent with the analysis presented by Becker et al. (2012), who found that for sources with luminosity LX ≲ Lcrit, the emission height tends to decrease with increasing luminosity, where Lcrit is the critical luminosity for radiation pressure to decelerate the flow. The width parameter, σc, represents a combination of the intrinsic thermal and natural line broadening, plus the effect of the field gradient through the column height, which causes the cyclotron energy to vary over a large range, changing by a factor of ∼30 between the stellar surface and the top of the column, located at radius rtop = 3.1 R*.
It is interesting to examine the results obtained for the various scattering cross sections in the low and high states. In keeping with the expectation of Thomson scattering in the direction perpendicular to the magnetic field in luminous sources, we set σ⊥/σT = 1 in both the low and high states (Becker & Wolff 2007; Wang & Frank 1981). On the other hand, for photons propagating parallel to the magnetic field, we find that the scattering cross section is σ||/σT = 1.23 × 10⁻⁵ in the high state, and σ||/σT = 1.89 × 10⁻⁵ in the low state. These values are quite similar, and the minor difference between them can be attributed to the different values for the CRSF energy, ϵc, obtained in the two states, with ϵc = 50.1 keV in the low state, and ϵc = 60.0 keV in the high state. The lower value of ϵc in the low state implies that the continuum energy region is closer to the cyclotron resonance, which tends to amplify the scattering cross section (Wang & Frank 1981).
It is also interesting to examine the variation in the dynamical structure of the accretion column during the outburst. In both the high and low states, we find that the dynamical parameter k∞ = 1, indicating that the velocity profile of the accreting gas merges smoothly with Newtonian free-fall far from the NS, as expected. However, the dynamical parameter k0, which determines the impact velocity of the gas at the stellar surface, is different in the two states. In the high state, we find that k0 = 0, indicating that the gas settles onto the NS surface with zero velocity, which is the expected behavior in high-luminosity accretion-powered XRPs due to the effect of the strong radiation pressure gradient force in these sources (Davidson 1973; Basko & Sunyaev 1976).
In the low state, we find that k0 = 0.1, which indicates that the gas collides with the stellar surface with impact velocity υ* = 0.064 c. This occurs because the radiation pressure gradient force is too small to entirely decelerate the accreting gas to rest at the stellar surface. In this case, the final deceleration and merger of the accreting matter with the NS crust presumably occurs via passage through a thin discontinuous shock, and the residual kinetic energy in the accretion flow powers the emission of the blackbody seed photons from the hot spot at the stellar surface (Langer & Rappaport 1982; Becker & Wolff 2005a,b).
In the BW22 model, the velocity profile defined by the constants k0 and k∞ is considered to be an input to the model, and the corresponding emergent spectrum is computed based on this input velocity profile, combined with a realistic radiation transport equation and a set of appropriate physical boundary conditions. Although the velocity profile is considered to be an input to the model, its validity can be evaluated after the fact by using the resulting radiation spectrum and gas temperature and density variations to compute the pressure gradients, which can be combined with the gravitational force to recompute the velocity profile by solving numerically the hydrodynamical conservation equations for the gas. This procedure was carried out by BW22 for their model of Her X-1 and the velocity profile was found to be essentially physically self-consistent, which is also the case here.
5. Discussion
The Type II giant outburst of RX J0440.9+4431 in 2022–2023 was intensively observed using Insight-HXMT. By analyzing the wide-band Insight-HXMT spectra during the outburst, we find that as the luminosity increases, the spectrum of this source gradually changes. In particular, when the luminosity exceeds 3× 1037 erg s−1, the emission increases significantly in the energy ranges ∼2 keV and ∼20–40 keV. This spectral evolution causes the SC to decrease as the count rate increases when the source is bright. Conversely, the HC increases continually as the count rate increases (see Fig. 1). This behavior is consistent with the work of Reig & Nespoli (2013), who conducted a systematic study on HID/SC of Be X-ray binaries and identified two spectral branches: the horizontal branch corresponds to a low-intensity state of the source, and the diagonal branch represents a high-intensity state occurring when the X-ray luminosity exceeds a critical limit. Therefore, they concluded that the spectrum softens in the high state for many sources, in agreement with our findings during the outburst of RX J0440.9+4431 studied here.
However, if we focus on higher energies, we note that the HC of RX J0440.9+4431 increases as the count rate rises, indicating that the high-energy spectrum becomes harder. We note that the HC of KS 1947+300, 4U 0115+63, and EXO 2030+375 in Reig (2008) also exhibits a similar trend. Therefore, we cannot solely rely on the changes in SC to claim that the spectrum softens, and these variations in SC and HC are likely common characteristics of the majority of Be X-ray binaries during the outburst. Figure 2 aids in better understanding these two features and also suggests that Be X-ray binaries such as KS 1947+300, 4U 0115+63, and EXO 2030+375 may undergo similar changes to RX J0440.9+4431 in their high states, especially with increases in the intensity for photon energies ∼2 keV and ∼20–40 keV. Hence, it may be more accurate to describe the spectral evolution as a flattening of the spectrum in the high state, which is apparent in the spectra plotted in Fig. 3. Additionally, this behavior, as seen from the right panel of Fig. 2, is phase-dependent, implying a direct association with radiation from the accretion column.
We selected two ObsIDs from the Insight-HXMT data to represent the low and high states of RX J0440.9+4431. Figure 3 shows the results fitted with commonly used phenomenological models. As mentioned earlier, there is a significant increase in emission around ∼2 keV and ∼20–40 keV in the high state. This naturally implies the need for a low-temperature blackbody at high states, while another blackbody, to account for the emission at high energies, becomes very hot. Additionally, the comptt model requires a larger optical depth to achieve a flatter spectrum. While these models can fit the spectra well, gaining detailed insight into the fundamental accretion physics remains challenging.
To further study the radiation mechanism of RX J0440.9+4431, we also used the BW22 model to qualitatively fit the spectra, since this model provides a complete physical description of the spectral formation processes occurring in an XRP accretion column. The relative radiated power distributions over the emission components obtained using the BW22 model in the high and low states are reported in Table 5. We note that in both the high and low states, the radiated power is dominated by Comptonized bremsstrahlung emission, with ∼90% of this emission escaping through the column walls. However, the proportion of the emission escaping through the column top decreases in the low state. This can be understood as follows. In the low state, due to the dynamical parameter value k0 = 0.1, the average speed of the accretion flow is higher than that it is in the high state, with k0 = 0. The increased flow velocity in the low state enhances the level of photon “trapping,” so that the radiation tends to be swept downstream, resulting in a higher proportion of the emission escaping through the column walls, rather than the top, when the source is in the low state (Becker & Wolff 2007).
Distribution of radiated power over the BW22 model emission components in the high and low states.
The plot of the pulse profile on the right-hand side of Fig. 2 indicates that when the source is in the high state, the spectrum becomes significantly harder near the peak of the pulse profile. It is interesting to correlate this with the plot of the phase-averaged spectrum computed using the BW22 model, depicted in the right-hand panel of Fig. 4. The theoretical results for the spectrum show that in the high state, the bremsstrahlung component emitted from the column top is significantly harder than that emitted through the column walls. However, the column top component makes a weaker contribution to the phase-averaged spectrum than does the wall component. Hence, the question of whether the hardening of the spectrum at the peak of the pulse can be explained by the BW22 model depends on the details of the beaming pattern for the radiation escaping through the column top, which we briefly discuss below.
The emission escaping through the column top is expected to be strongly beamed in the direction of the magnetic field, which is essentially the radial direction. This focusing effect will tend to boost the contribution of the column top emission to the pulse profile, if the column top is aligned with the distant observer at the peak of the pulse. Hence, in this scenario, the focused emission from the column top could produce a significant hardening of the spectrum at the pulse peak, as observed. While this is an interesting possibility, ultimately, this question cannot be answered in a quantitative way without a phase-resolved calculation of the theoretical spectral components escaping through the walls and top of the accretion column, which is beyond the scope of this paper. We plan to compute phase-resolved theoretical spectra in future work.
It is instructive to compare the behavior of RX J0440.9+4431 with that of Her X-1, which was treated by Becker & Wolff (2022) using the same model employed here. We note that the accretion rate for Her X-1 is similar to that in the high state of RX J0440.9+4431. Based on its magnetic field strength, derived from CRSF observations, Her X-1 is estimated to be super-critical, with LX ≳ Lcrit, when at maximum luminosity (Becker et al. 2012). On the other hand, because of its stronger estimated magnetic field strength, RX J0440.9+4431 may be quasi-critical when in the highest state considered here, with LX ∼ Lcrit. The behaviors of the two sources are similar, although there are some differences. For example, the spectrum of Her X-1 tends to get harder with increasing luminosity (Staubert et al. 2020, 2019), and RX J0440.9+4431 likewise exhibits an increase in high-energy radiation with increasing luminosity, although the spectrum also becomes flatter in the energy range around ∼2 keV and 20–40 keV. Furthermore, in both Her X-1 and RX J0440.9+4431, we find that the radiation emerges primarily from the side of the accretion column rather than from the top, which is consistent with expectations for sources in this luminosity range (Becker & Wolff 2007). The slight differences in behavior may stem from the stronger magnetic field obtained in the case of RX J0440.9+4431, which leads to electron scattering cross sections that are a factor of ∼3 smaller than those obtained in the case of Her X-1 (Becker & Wolff 2022).
6. Conclusion
We have analyzed the evolution of the X-ray spectrum from the BeXRB source RX J0440.9+4431 during the Type II giant outburst that occurred in 2022–2023. We interpreted the data via phenomenological fitting, and also via comparisons with simulations carried out using the BW22 physics-based model. One important result of the phenomenological fitting is that as the luminosity approached the critical luminosity during the outburst, the spectrum became flatter, with the increase in the spectrum primarily concentrated around ∼2 keV, with an accompanying hardening in the energy range 20–40 keV. This behavior is consistent with the results of Reig (2011), who conducted a study of several variable BeXRB systems and found that as the source reaches its highest luminosity, the SC decreases (along the diagonal branch) but the HC increases, indicating hardening at higher photon energies. We obtain similar results here, as indicated in Fig. 1.
To obtain additional physical insight, we also performed simulations using the BW22 theoretical model. The results indicate that the electron temperature in the accretion column was Te = 1.19 × 10⁸ K in the high state and Te = 1.40 × 10⁸ K in the low state. The lower electron temperature in the high state is driven by an increase in the efficiency of bremsstrahlung cooling with higher accretion rates. Furthermore, we find that the Comptonization parameter ψ decreases in the high state, indicating a decrease in bulk Comptonization relative to thermal Comptonization. These factors combine to explain the flattening of the spectrum in the high state. We also find that the CRSF formation radius decreases in the high state. Taken together, these facts provide the first quantitative explanation for the suggestion made by Reig & Nespoli (2013), that the spectral softening in the high state is a consequence of a decrease in the altitude above the stellar surface where most of the emission is produced; this leads to a compactification of the emission region, which allows the photons to diffuse more effectively out of the region of maximum bulk Comptonization.
Acknowledgments
We thank the anonymous referee for valuable comments and suggestions. We also thank the Insight-HXMT science team for the valuable suggestions, which have improved the paper. This research utilized data and software from the Insight-HXMT mission, supported by the China National Space Administration (CNSA) and the Chinese Academy of Sciences (CAS). Financial support for this work is provided by the National Key R&D Program of China (2021YFA0718500). We also acknowledge funding from the National Natural Science Foundation of China (NSFC) under grant numbers 12122306, 12333007, and U2038102, as well as support from the CAS Pioneer Hundred Talent Program (Y8291130K2), the Strategic Priority Research Program of the Chinese Academy of Sciences (No. XDB0550300), and the Scientific and Technological Innovation Project of IHEP (Y7515570U1).
References
- Basko, M. M., & Sunyaev, R. A. 1976, MNRAS, 175, 395 [Google Scholar]
- Becker, P. A. 1998, ApJ, 498, 790 [NASA ADS] [CrossRef] [Google Scholar]
- Becker, P. A., & Wolff, M. T. 2005a, ApJ, 621, L45 [NASA ADS] [CrossRef] [Google Scholar]
- Becker, P. A., & Wolff, M. T. 2005b, ApJ, 630, 465 [NASA ADS] [CrossRef] [Google Scholar]
- Becker, P. A., & Wolff, M. T. 2007, ApJ, 654, 435 [NASA ADS] [CrossRef] [Google Scholar]
- Becker, P. A., & Wolff, M. T. 2022, ApJ, 939, 67 [NASA ADS] [CrossRef] [Google Scholar]
- Becker, P. A., Klochkov, D., Schönherr, G., et al. 2012, A&A, 544, A123 [NASA ADS] [CrossRef] [EDP Sciences] [Google Scholar]
- Belenkaya, E. S., Khodachenko, M. L., & Alexeev, I. I. 2015, Astrophys. Space Sci. Lib., 411, 239 [NASA ADS] [CrossRef] [Google Scholar]
- Blandford, R. D., & Payne, D. G. 1981, MNRAS, 194, 1041 [NASA ADS] [Google Scholar]
- Cao, X., Jiang, W., Meng, B., et al. 2020, Sci. China Phys. Mech. Astron., 63, 249504 [NASA ADS] [CrossRef] [Google Scholar]
- Chen, Y., Cui, W., Li, W., et al. 2020, Sci. China Phys. Mech. Astron., 63, 249505 [NASA ADS] [CrossRef] [Google Scholar]
- Coburn, W., Heindl, W. A., Rothschild, R. E., et al. 2002, ApJ, 580, 394 [NASA ADS] [CrossRef] [Google Scholar]
- Coley, J. B., Gendreau, K., Pottschmidt, K., et al. 2023, ATel, 15907, 1 [NASA ADS] [Google Scholar]
- Davidson, K. 1973, Nat. Phys. Sci., 246, 1 [NASA ADS] [CrossRef] [Google Scholar]
- Farinelli, R., Ceccobello, C., Romano, P., & Titarchuk, L. 2012, A&A, 538, A67 [NASA ADS] [CrossRef] [EDP Sciences] [Google Scholar]
- Ferrigno, C., Falanga, M., Bozzo, E., et al. 2011, A&A, 532, A76 [CrossRef] [EDP Sciences] [Google Scholar]
- Ferrigno, C., Farinelli, R., Bozzo, E., et al. 2013, A&A, 553, A103 [NASA ADS] [CrossRef] [EDP Sciences] [Google Scholar]
- Fu, Y.-C., Song, L. M., Ding, G. Q., et al. 2023, MNRAS, 521, 893 [CrossRef] [Google Scholar]
- Gorban, A. S., Molkov, S. V., Tsygankov, S. S., & Lutovinov, A. A. 2021, Astron. Lett., 47, 390 [NASA ADS] [CrossRef] [Google Scholar]
- Harding, A. K., & Lai, D. 2006, Rep. Prog. Phys., 69, 2631 [NASA ADS] [CrossRef] [Google Scholar]
- Harding, A. K., Meszaros, P., Kirk, J. G., & Galloway, D. J. 1984, ApJ, 278, 369 [CrossRef] [Google Scholar]
- Heindl, W. A., & Chakrabarty, D. 1999, Am. Astron. Soc. Meeting Abstr., 272, 25 [NASA ADS] [Google Scholar]
- HI4PI Collaboration (Ben Bekhti, N., et al.) 2016, A&A, 594, A116 [NASA ADS] [CrossRef] [EDP Sciences] [Google Scholar]
- Hickox, R. C., Narayan, R., & Kallman, T. R. 2004, ApJ, 614, 881 [NASA ADS] [CrossRef] [Google Scholar]
- Hou, X., Ge, M. Y., Ji, L., et al. 2022, ApJ, 938, 149 [NASA ADS] [CrossRef] [Google Scholar]
- Jaisawal, G. K., Wilson-Hodge, C. A., Fabian, A. C., et al. 2019, ApJ, 885, 18 [NASA ADS] [CrossRef] [Google Scholar]
- Kong, L. D., Zhang, S., Chen, Y. P., et al. 2020, ApJ, 902, 18 [NASA ADS] [CrossRef] [Google Scholar]
- Kong, L. D., Zhang, S., Ji, L., et al. 2021, ApJ, 917, L38 [NASA ADS] [CrossRef] [Google Scholar]
- Krivonos, R., Tsygankov, S., Lutovinov, A., Turler, M., & Bozzo, E. 2010, ATel, 2828, 1 [NASA ADS] [Google Scholar]
- Lamb, F. K., Pethick, C. J., & Pines, D. 1973, ApJ, 184, 271 [NASA ADS] [CrossRef] [Google Scholar]
- Langer, S. H., & Rappaport, S. 1982, ApJ, 257, 733 [NASA ADS] [CrossRef] [Google Scholar]
- Li, P. P., Tao, L., Tuo, Y. L., et al. 2023, MNRAS, 526, 3637 [Google Scholar]
- Li, P. P., Tao, L., Ma, R. C., et al. 2024, MNRAS, 529, 1187 [NASA ADS] [CrossRef] [Google Scholar]
- Liu, C., Zhang, Y., Li, X., et al. 2020, Sci. China Phys. Mech. Astron., 63, 249503 [NASA ADS] [CrossRef] [Google Scholar]
- Lutovinov, A., Tsygankov, S., Molkov, S., et al. 2021, ApJ, 912, 17 [Google Scholar]
- Mandal, M., & Pal, S. 2022, MNRAS, 511, 1121 [NASA ADS] [CrossRef] [Google Scholar]
- Mandal, M., Sharma, R., Pal, S., et al. 2023, MNRAS, 526, 771 [NASA ADS] [CrossRef] [Google Scholar]
- Mihara, T., Makishima, K., & Nagase, F. 1995, Am. Astron. Soc. Meeting Abstr., 187, 10403 [Google Scholar]
- Morii, M., Kawai, N., Sugimori, K., et al. 2010, ATel, 2527, 1 [NASA ADS] [Google Scholar]
- Mushtukov, A., & Tsygankov, S. 2022, ArXiv e-prints [arXiv:2204.14185] [Google Scholar]
- Nakajima, M., Negoro, H., Mihara, T., et al. 2022, ATel, 15835, 1 [NASA ADS] [Google Scholar]
- Orlandini, M., dal Fiume, D., Frontera, F., et al. 1998, A&A, 332, 121 [Google Scholar]
- Pal, S., Mandal, M., Gendreau, K., et al. 2023, ATel, 15868, 1 [NASA ADS] [Google Scholar]
- Reig, P. 2008, A&A, 489, 725 [NASA ADS] [CrossRef] [EDP Sciences] [Google Scholar]
- Reig, P. 2011, Ap&SS, 332, 1 [Google Scholar]
- Reig, P., & Nespoli, E. 2013, A&A, 551, A1 [NASA ADS] [CrossRef] [EDP Sciences] [Google Scholar]
- Rouco Escorial, A., Bak Nielsen, A. S., Wijnands, R., et al. 2017, MNRAS, 472, 1802 [NASA ADS] [CrossRef] [Google Scholar]
- Salganik, A., Tsygankov, S. S., & Doroshenko, V., et al. 2023, MNRAS, 524, 5213 [NASA ADS] [CrossRef] [Google Scholar]
- Sheng, X., Zhang, L., Blaes, O., & Jiang, Y.-F. 2023, MNRAS, 524, 2431 [NASA ADS] [CrossRef] [Google Scholar]
- Soong, Y., Gruber, D. E., Peterson, L. E., & Rothschild, R. E. 1990, ApJ, 348, 641 [NASA ADS] [CrossRef] [Google Scholar]
- Spruit, H. C., & Taam, R. E. 1993, ApJ, 402, 593 [CrossRef] [Google Scholar]
- Staubert, R., Trümper, J., Kendziorra, E., et al. 2019, A&A, 622, A61 [NASA ADS] [CrossRef] [EDP Sciences] [Google Scholar]
- Staubert, R., Ducci, L., Ji, L., et al. 2020, A&A, 642, A196 [NASA ADS] [CrossRef] [EDP Sciences] [Google Scholar]
- Tamang, R., Ghising, M., Tobrej, M., Rai, B., & Paul, B. C. 2022, MNRAS, 515, 5407 [CrossRef] [Google Scholar]
- Tamang, R., Ghising, M., Tobrej, M., Rai, B., & Paul, B. C. 2024, MNRAS, 527, 3164 [Google Scholar]
- Tao, L., Feng, H., Zhang, S., et al. 2019, ApJ, 873, 19 [Google Scholar]
- Tsygankov, S., Lutovinov, A., & Krivonos, R. 2011, ATel, 3137, 1 [NASA ADS] [Google Scholar]
- Tsygankov, S. S., Krivonos, R. A., & Lutovinov, A. A. 2012, MNRAS, 421, 2407 [CrossRef] [Google Scholar]
- Tsygankov, S. S., Lutovinov, A. A., Doroshenko, V., et al. 2016a, A&A, 593, A16 [NASA ADS] [CrossRef] [EDP Sciences] [Google Scholar]
- Tsygankov, S. S., Lutovinov, A. A., Krivonos, R. A., et al. 2016b, MNRAS, 457, 258 [NASA ADS] [CrossRef] [Google Scholar]
- Usui, R., Morii, M., Kawai, N., et al. 2012, PASJ, 64, 79 [NASA ADS] [Google Scholar]
- Verner, D. A., Ferland, G. J., Korista, K. T., & Yakovlev, D. G. 1996, ApJ, 465, 487 [Google Scholar]
- Wang, Y. M., & Frank, J. 1981, A&A, 93, 255 [Google Scholar]
- Wang, P. J., Kong, L. D., Zhang, S., et al. 2022, ApJ, 935, 125 [NASA ADS] [CrossRef] [Google Scholar]
- Weng, S.-S., Ge, M.-Y., & Zhao, H.-H. 2019, MNRAS, 489, 1000 [NASA ADS] [CrossRef] [Google Scholar]
- White, N. E., Swank, J. H., & Holt, S. S. 1983, ApJ, 270, 711 [NASA ADS] [CrossRef] [Google Scholar]
- Wilms, J., Allen, A., & McCray, R. 2000, ApJ, 542, 914 [Google Scholar]
- Wolff, M. T., Becker, P. A., Gottlieb, A. M., et al. 2016, ApJ, 831, 194 [Google Scholar]
- Zhang, S.-N., Li, T., Lu, F., et al. 2020, Sci. China Phys. Mech. Astron., 63, 249502 [NASA ADS] [CrossRef] [Google Scholar]
- Zhang, L., Blaes, O., & Jiang, Y.-F. 2022, MNRAS, 515, 4371 [NASA ADS] [CrossRef] [Google Scholar]
All Tables
Best-fitting spectral parameters of the Insight-HXMT observations of RX J0440.9+4431 using model 1 and model 2. Uncertainties are given at 90%.
Input theoretical parameters used for qualitatively fitting the BW22 model to the Insight-HXMT data for high and low states.
Distribution of radiated power over the BW22 model emission components in the high and low states.
All Figures
|
Fig. 1. Hardness-intensity diagram (HID) of the RX J0440.9+4431 2022–2023 giant outburst observed with Insight-HXMT. The arrows show the direction of the evolution. The black and gray colors represent the rising and declining parts of the outburst, respectively. The red stars indicate the representative low and high state data used for the spectral fits. |
| In the text | |
|
Fig. 2. Spectral evolution observed during the 2022–2023 giant outburst. Left panel: spectral evolution and pulse profile of RX J0440.9+4431 during the outburst, based on Insight-HXMT data. The color bar signifies flux intensity, with dark blue denoting periods without observations. White dots represent X-ray luminosity in the 0.3–120 keV energy range, aligned with the right y-axis. Two dashed-dotted lines (MJD 59948; MJD 59981) indicate the positions of ObsID P0514361005 (low state) and ObsID P0514361040 (high state), respectively. Right panel: evolution of the energy ratio over phase from ObsID P0514361040. The solid black line represents the pulse profile for 70–100 keV (Li et al. 2023), corresponding to the right y-axis. |
| In the text | |
|
Fig. 3. Unfolded spectra, phenomenological model components, and spectral residuals for Insight-HXMT observations (red for LE; blue for ME; black for HE) of RX J0440.9+4431 with model 1 and model 2. |
| In the text | |
|
Fig. 4. Theoretical X-ray spectrum computed using the BW22 model, compared with Insight-HXMT data for RX J0440.9+443, during two epochs of the 2022–2023 giant outburst. The magenta points in the left panel refer to the low state (MJD 59948), with luminosity LX = 9.23 × 1036 erg s−1, and the cyan points in the right panel refer to the high state (MJD 59981), with luminosity LX = 3.44 × 1037 erg s−1. The theoretical spectral components computed using the BW22 model, corresponding to the reprocessing of bremsstrahlung, cyclotron, and blackbody seed photons escaping through the walls and top of the conical accretion column, are indicated. The solid blue curves denote the total spectra. |
| In the text | |
Current usage metrics show cumulative count of Article Views (full-text article views including HTML views, PDF and ePub downloads, according to the available data) and Abstracts Views on Vision4Press platform.
Data correspond to usage on the plateform after 2015. The current usage metrics is available 48-96 hours after online publication and is updated daily on week days.
Initial download of the metrics may take a while.