Fig. 2.
Download original image
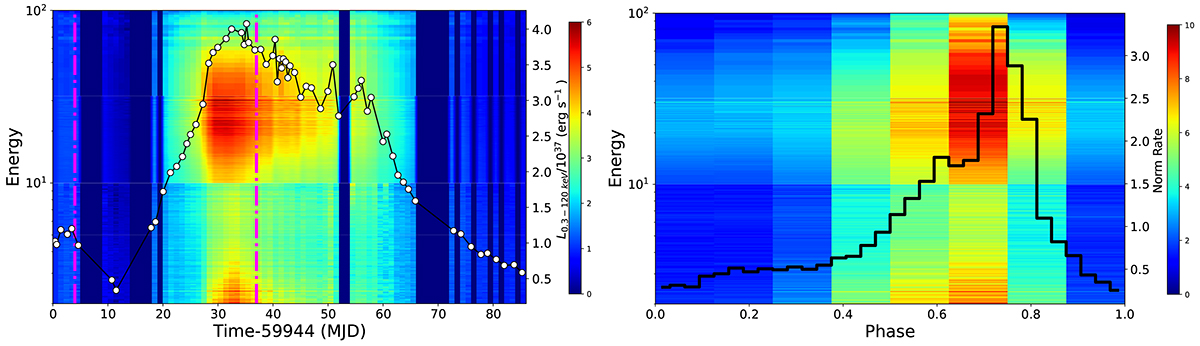
Spectral evolution observed during the 2022–2023 giant outburst. Left panel: spectral evolution and pulse profile of RX J0440.9+4431 during the outburst, based on Insight-HXMT data. The color bar signifies flux intensity, with dark blue denoting periods without observations. White dots represent X-ray luminosity in the 0.3–120 keV energy range, aligned with the right y-axis. Two dashed-dotted lines (MJD 59948; MJD 59981) indicate the positions of ObsID P0514361005 (low state) and ObsID P0514361040 (high state), respectively. Right panel: evolution of the energy ratio over phase from ObsID P0514361040. The solid black line represents the pulse profile for 70–100 keV (Li et al. 2023), corresponding to the right y-axis.
Current usage metrics show cumulative count of Article Views (full-text article views including HTML views, PDF and ePub downloads, according to the available data) and Abstracts Views on Vision4Press platform.
Data correspond to usage on the plateform after 2015. The current usage metrics is available 48-96 hours after online publication and is updated daily on week days.
Initial download of the metrics may take a while.