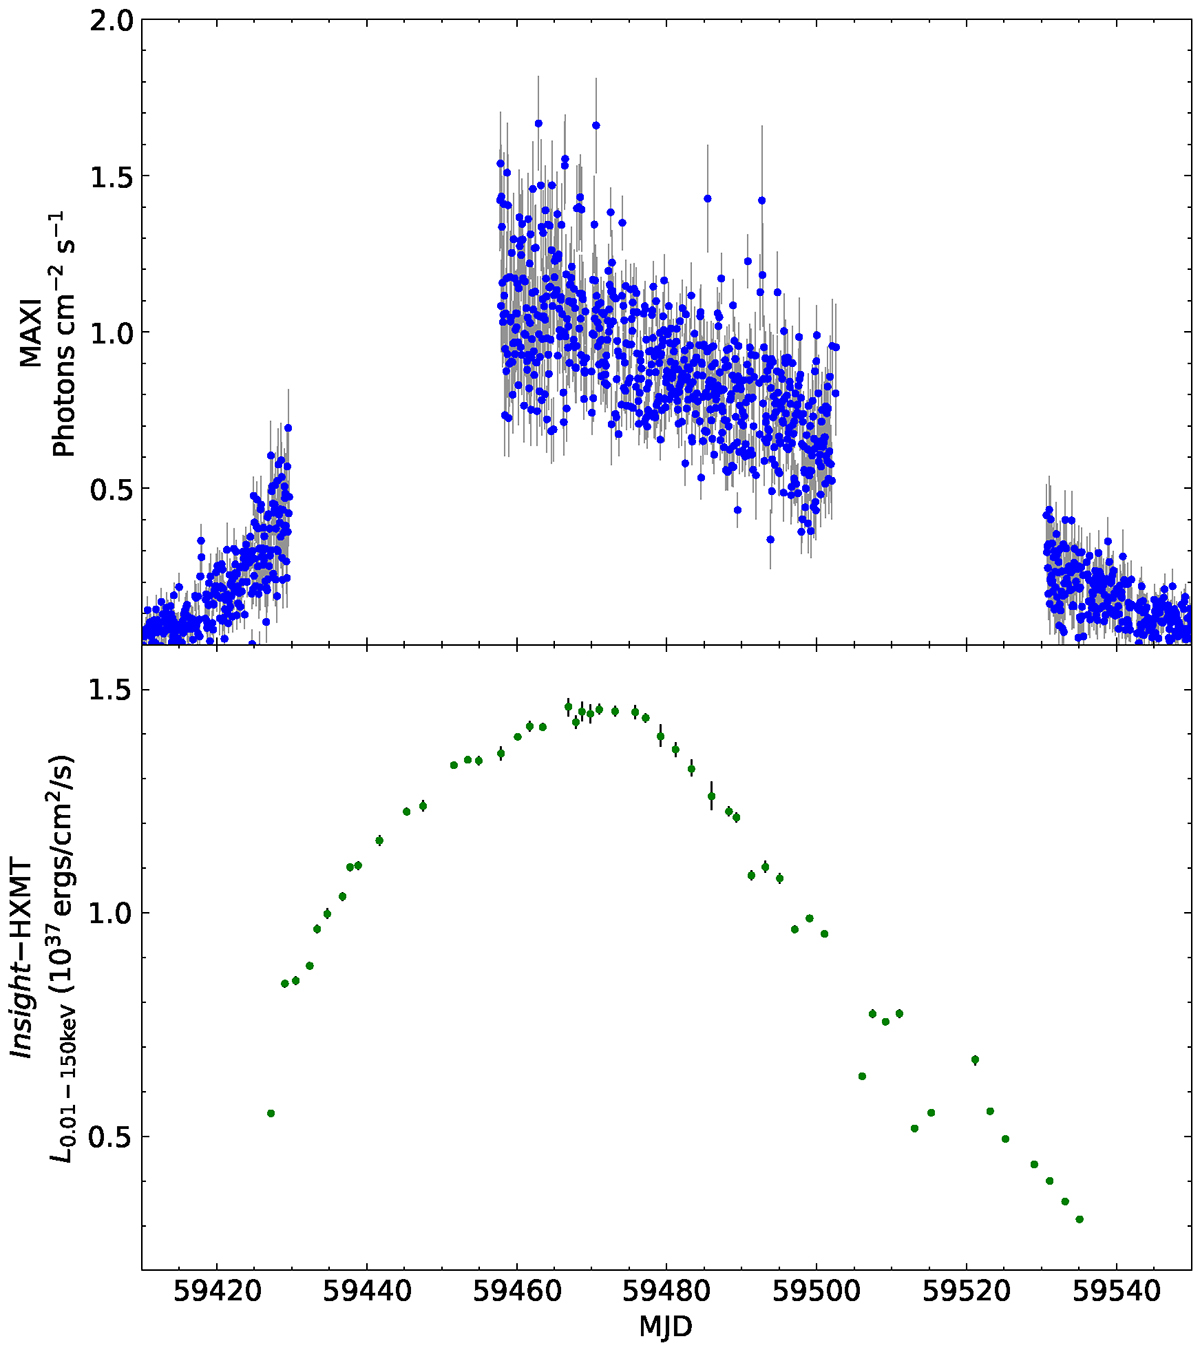
Fig. 1.
Download original image
Light curve of EXO 2030+375 as measured by MAXI (2−20 keV), with data binned over one orbital revolution of the International Space Station, where MAXI is mounted (∼1.5 hours), shown in the first panel. The second panel shows the light curve from the Insight-HXMT observations during the 2021 giant outburst. Each point represents the daily-averaged luminosity (0.01−150 keV), derived through spectral fitting of the Insight-HXMT data.
Current usage metrics show cumulative count of Article Views (full-text article views including HTML views, PDF and ePub downloads, according to the available data) and Abstracts Views on Vision4Press platform.
Data correspond to usage on the plateform after 2015. The current usage metrics is available 48-96 hours after online publication and is updated daily on week days.
Initial download of the metrics may take a while.