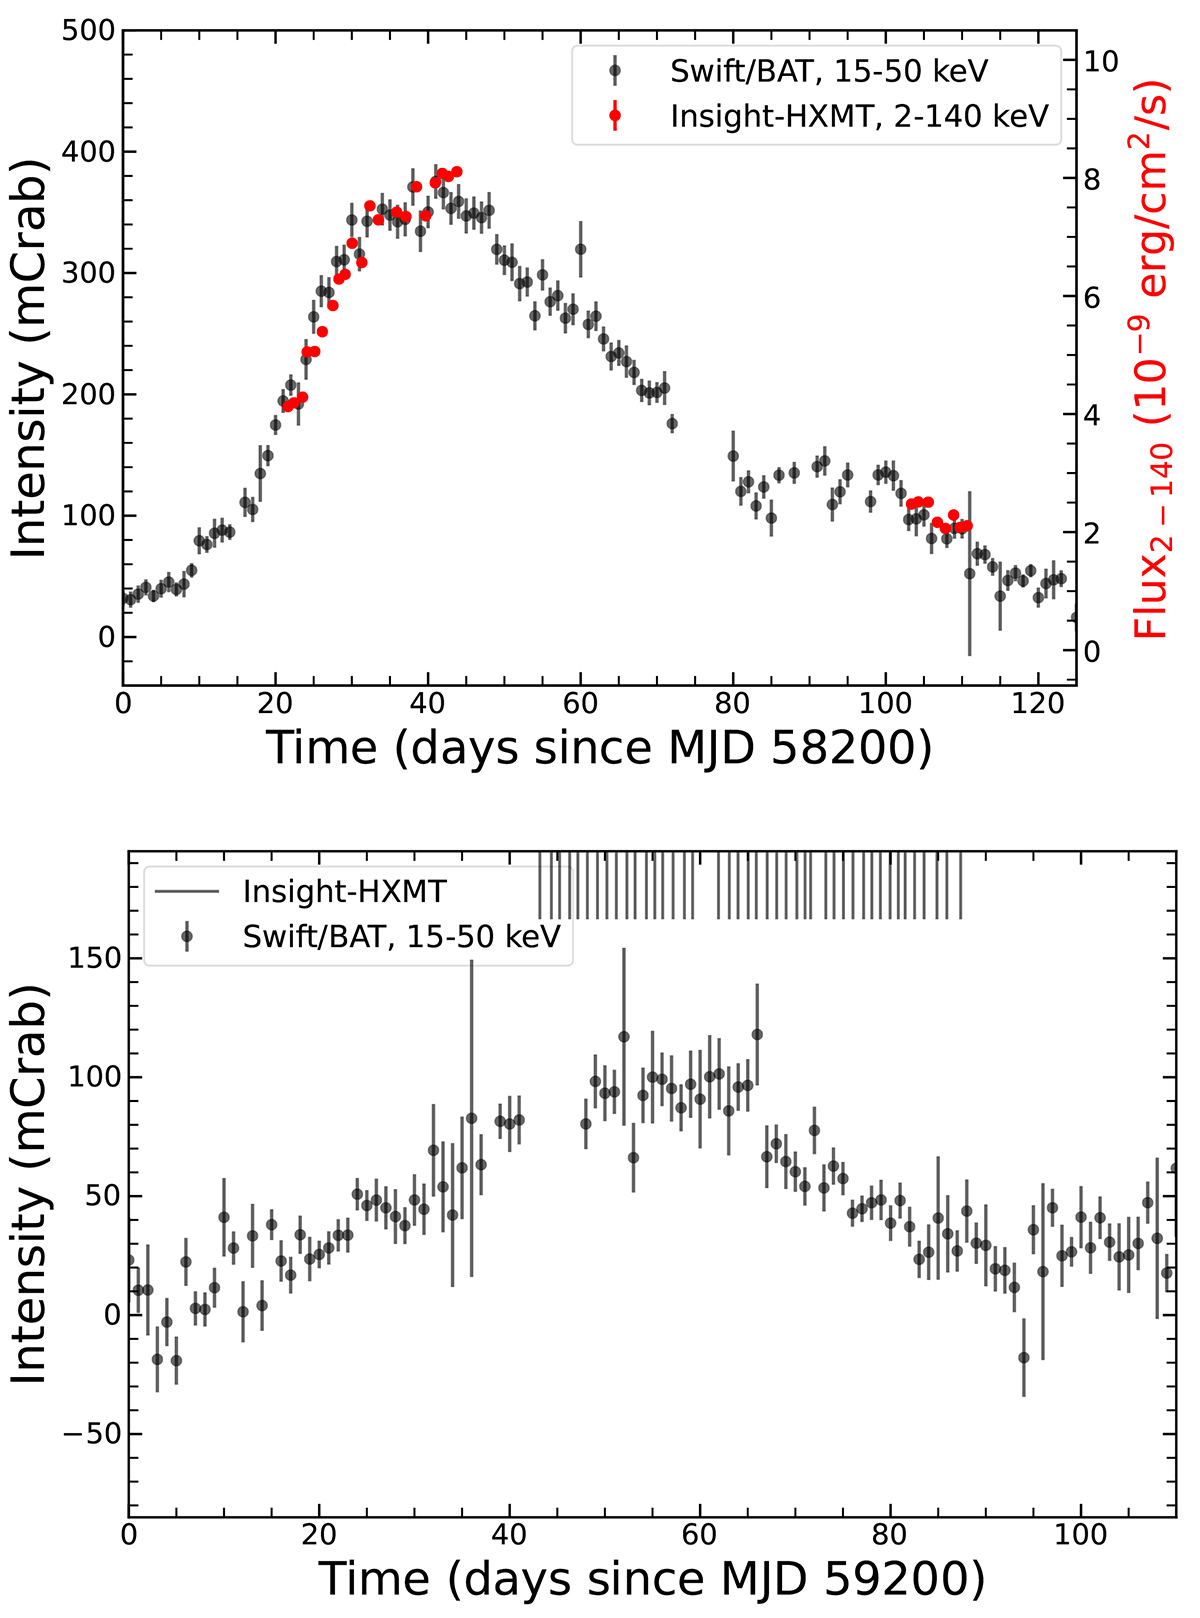
Fig. 1.
Download original image
Light curve of 2S 1417–624 at 15−50 keV, as observed by Swift/BAT during the 2018 and 2021 outbursts. Upper panel: Total of 29 pointing observations conducted by Insight-HXMT in 2018, as indicated by the red points with the flux in the 2−140 keV energy band. Bottom panel: Vertical black lines indicating the Insight-HXMT observations in 2021. Table A.1 provides details of the observational information.
Current usage metrics show cumulative count of Article Views (full-text article views including HTML views, PDF and ePub downloads, according to the available data) and Abstracts Views on Vision4Press platform.
Data correspond to usage on the plateform after 2015. The current usage metrics is available 48-96 hours after online publication and is updated daily on week days.
Initial download of the metrics may take a while.