Open Access
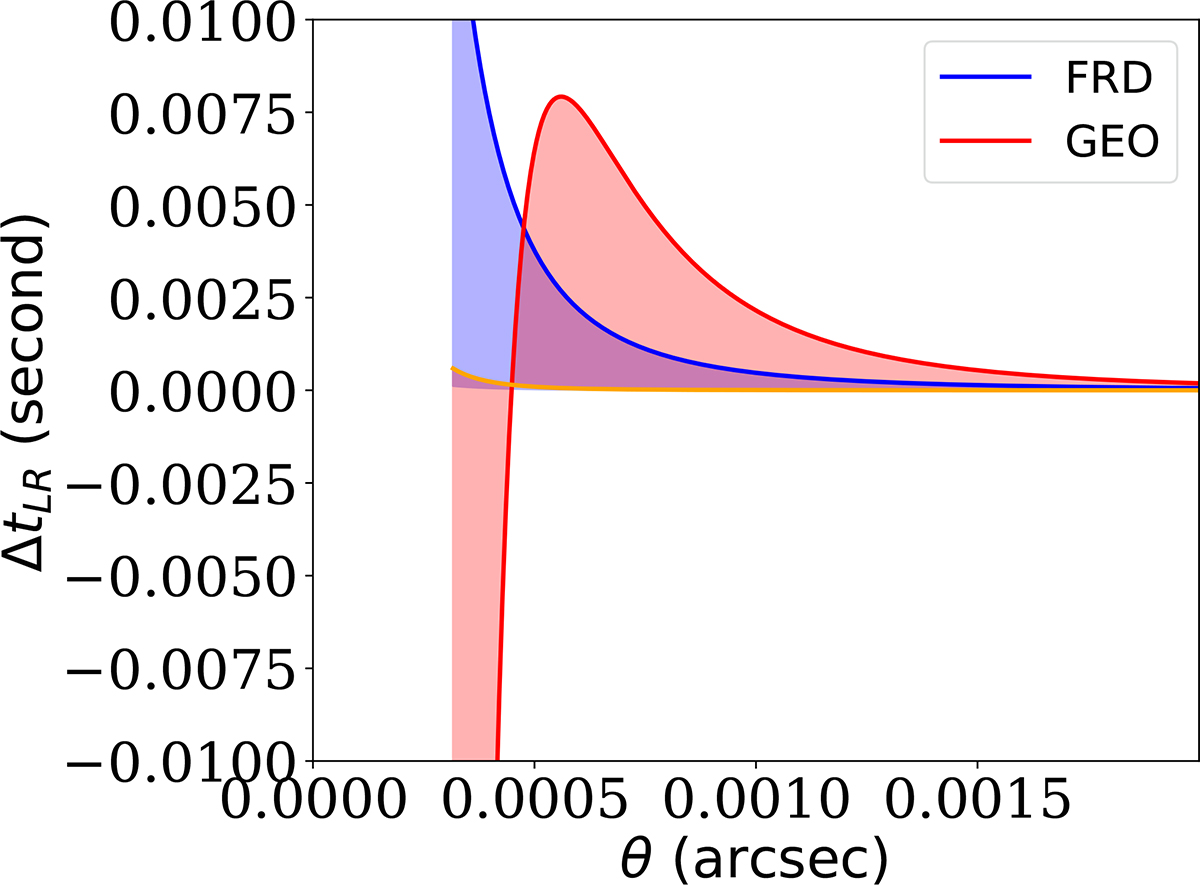
Fig. 7.
Download original image
Similar to Fig. 1; red represents arrival-time difference between the two modes of the wave caused by the different paths of the light propagation (textraordinary−tordinary). The shadows cover a frequency range from 1 to 5 GHz.
Current usage metrics show cumulative count of Article Views (full-text article views including HTML views, PDF and ePub downloads, according to the available data) and Abstracts Views on Vision4Press platform.
Data correspond to usage on the plateform after 2015. The current usage metrics is available 48-96 hours after online publication and is updated daily on week days.
Initial download of the metrics may take a while.