| Issue |
A&A
Volume 699, July 2025
|
|
|---|---|---|
| Article Number | A356 | |
| Number of page(s) | 14 | |
| Section | Galactic structure, stellar clusters and populations | |
| DOI | https://doi.org/10.1051/0004-6361/202554412 | |
| Published online | 22 July 2025 | |
A chemical close-up of the main body of the Sagittarius dwarf galaxy
1
Section of Astrophysics, Astronomy and Mechanics, Physics Department, National and Kapodistrian University of Athens, Panepistimiopolis,
15784
Zografos,
Athens,
Greece
2
Dipartimento di Fisica e Astronomia “Augusto Righi”, Alma Mater Studiorum, Università di Bologna,
Via Gobetti 93/2,
40129
Bologna,
Italy
3
INAF – Osservatorio di Astrofisica e Scienza dello Spazio di Bologna,
Via Gobetti 93/3,
40129
Bologna,
Italy
4
INAF – Osservatorio Astrofisico di Arcetri,
Largo E. Fermi 5,
50125
Firenze,
Italy
★ Corresponding author.
Received:
7
March
2025
Accepted:
1
June
2025
Abstract
We present the chemical composition of a sample of 37 red giant branch (RGB) stars belonging to the main body of the remnant of the Sagittarius (Sgr) dwarf spheroidal galaxy. All stars were observed with the FLAMES-UVES high-resolution spectrograph. Twenty-three new targets were selected along the blue side of the RGB of Sgr, but outside the galaxy stellar nucleus, in order to avoid contamination by the stars of the metal-poor globular cluster M54. Additionally, we re-analysed archival spectra of 14 targets located on the red RGB. For this sample, we derive the abundances of 21 chemical species (from oxygen to europium) representing different nucleosynthetic sites. The sample covers a large range of metallicities, from [Fe/H]~-2 to ~-0.4 dex, and we can identify the transition between the enrichment phases dominated by core-collapse and Type Ia supernovae. The observed [α/Fe] trend suggests a knee occurring at [Fe/H]~ −1.5/−1.3 dex, compatible with the rather low star formation efficiency of Sgr. At lower [Fe/H], Sgr stars exhibit a chemical composition compatible with Milky Way stars of similar [Fe/H]. The only relevant exceptions are [Mn/Fe], [Zn/Fe], and [Eu/Fe]. Instead, at [Fe/H] higher than −1.5/−1.3 dex, the chemical pattern of Sgr significantly deviates from that of the Milky Way for almost all the elements analysed in this study. Some of the abundance patterns reveal a lower contribution by very massive stars exploding as hypernovae (e.g. [Mn/Fe], [Zn/Fe]), a higher contribution by sub-Chandrasekhar progenitors of Type Ia supernovae (e.g. [Ni/Fe]), and a high production efficiency of rapid neutron-capture elements ([Eu/Fe]).
Key words: galaxies: abundances / galaxies: dwarf / Local Group
© The Authors 2025
 Open Access article, published by EDP Sciences, under the terms of the Creative Commons Attribution License (https://creativecommons.org/licenses/by/4.0), which permits unrestricted use, distribution, and reproduction in any medium, provided the original work is properly cited.
This article is published in open access under the Subscribe to Open model. This email address is being protected from spambots. You need JavaScript enabled to view it. to support open access publication.
1 Introduction
The remnant of the Sagittarius dwarf spheroidal galaxy (Sgr dSph, Ibata et al. 1994) is the closest and most emblematic case of a dwarf satellite in an advanced stage of tidal disruption, due to its ongoing merging with a larger galaxy, the Milky Way (MW). According to the most recent models, Sgr experienced several perigalactic passages around the MW, with the first infall occurring around 5 Gyr ago (Ruiz-Lara et al. 2020). Currently we observe a low-surface-brightness elongated spheroid remnant (the main body) and a tidal stream with leading and trailing branches for tens of kiloparsecs along their quasi-polar orbit (Majewski et al. 2003; Ibata et al. 2020; Ramos et al. 2022). By this interaction, Sgr is both actively influencing the star formation history of the MW and contributing to the formation of the MW halo by donating its stars (Laporte et al. 2019; Ruiz-Lara et al. 2020).
Sgr dSph has a stellar nucleus with a composite stellar population in terms of ages and metallicities, with a markedly bimodal metallicity distribution dominated by an old (≃10-13 Gyr) metal-poor component peaking around [Fe/H]≃ −1.6, corresponding to the globular cluster M 54, and an intermediate-age (≃4-6 Gyr) metal-rich component peaking around [Fe/H] ≃ −0.5, plus minor populations reaching super-solar metallicity at age ≃1.0 Gyr (Siegel et al. 2007; Bellazzini et al. 2008; Alfaro-Cuello et al. 2019). On the other hand, the core of the main body of Sgr outside the nucleus, exhibits a mono-modal metal-licity distribution, with a metal-rich peak at [Fe/H] ≃ −0.5 as in the nucleus, and a weak extended metal-poor tail reaching [Fe/H] ≤ −2.0 (Minelli et al. 2023, and references therein). It is generally accepted that the progenitor of Sgr dSph displayed a significant radial gradient in metallicity, and likely in age, that today is traced both in the main body and in the tidal stream (Bellazzini et al. 1999; Alard 2001; Bellazzini et al. 2006; Monaco et al. 2007; Carlin et al. 2012; De Boer et al. 2014; de Boer et al. 2015; Vitali et al. 2022).
Until the advent of Gaia, most of the analyses of the chemical composition of Sgr dSph stars were focused on the nuclear region, because of the high density of targets and intrinsic interest on the nucleus, and/or biased against metal-poor stars, as the contamination by foreground MW stars of photometrically selected samples was particularly strong on the blue side of the Sgr RGB, where metal-poor stars are located (Monaco et al. 2005; Sbordone et al. 2007; Carretta et al. 2010; McWilliam et al. 2013; Mucciarelli et al. 2017). Minelli et al. (2023) discuss in detail how a target selection based on Gaia astrometry is effective in tackling the MW contamination, thus allowing an unbiased sampling of stars spanning the entire metallicity range of the dwarf. A wealth of new studies to obtain a more complete view of the chemical composition of Sgr dSph stars have been published in recent years. Hayes et al. (2020) and Hasselquist et al. (2021) discuss the abundances of the α-elements Al, Ni, and Ce derived from the near-infrared spectroscopic survey APOGEE for stars distributed in the main body and in the stream. Hansen et al. (2018), Sestito et al. (2024), and Ou et al. (2025) investigated the chemical properties of some very metal-poor ([Fe/H] < −2 dex) Sgr stars, and find similar chemical properties between Sgr and MW stars of similar [Fe/H]. In addition, Vitali et al. (2025) discuss the chemical composition of 111 Sgr giant stars located outside the nuclear region and observed with FLAMES-GIRAFFE. They measured chemical abundances of 13 elements (all of them also analysed in this study) over a [Fe/H] range between −2.0 and −0.3 dex.
In this work we provide a valuable addition to the studies mentioned above by providing an extensive network of chemical abundances (21 elements, from oxygen to europium) for stars in a large metallicity range (−2≲[Fe/H]≲ −0.5) in the Sgr dSph main body. We provide chemical abundances for some elements (i.e. Mn, Ni, and Zn) that are crucial for understanding the chemical evolution of this galaxy and not extensively investigated in previous works. The combination of such features is fundamental for understanding the chemical evolution pathway and the intrinsic properties of the stellar populations within this galaxy. The different families of elements probed in this study allow us to characterize the enrichment by different stellar progenitors, from massive stars exploding as core-collapse supernovae (CC-SNe, producing most of the α-elements; e.g. Romano et al. 2010), to low- and intermediate-mass stars (which are important slow neutron-capture element producers at late times; e.g. Cescutti & Matteucci 2022) and Type Ia supernovae (SNe Ia, producing most of the Fe-peak elements; e.g. Kobayashi et al. 2020b; Palla 2021). In addition, this study provides results based on stellar spectra with a higher resolution than most other studies in this field.
The paper is organized as follows. Section 2 presents the spectroscopic dataset analysed in this study. Section 3 describes the methods used to infer the atmospheric parameters of the target stars, their radial velocities, and the chemical abundances. Sections 4 and 5 describe and discuss the derived chemical abundances and the resulting abundance patterns of Sgr. Finally, Section 6 summarizes the main results of this study.
2 Dataset
The dataset discussed here includes high-resolution spectra of 37 RGB stars, all of which belong to the Sgr galaxy. All the spectra were acquired with the high-resolution fibre-fed spectrograph UVES-FLAMES (Pasquini et al. 2002) mounted at the Very Large Telescope of ESO. For all the observations, we adopted the UVES set-up Red Arm 580 covering from 4800 to 6800 Å and with a spectral resolution of 47 000.
Twenty-three new targets were observed under the ESO programme 105.20AH.001 (PI: Bellazzini) and selected on the blue side of the Sgr RGB in order to privilege metalpoor stars. These 23 targets were selected following the same procedure described in Minelli et al. (2023), using the third data release (DR3) of the Gaia/ESA mission (Gaia Collaboration 2016; Gaia Collaboration 2021). In particular, to minimize the contamination from foreground MW stars, which is especially strong on the blue side of the Sgr RGB, we only selected stars with proper motions within 0.5 mas/yr of the systemic proper motion of Sgr, as determined by Gaia Collaboration (2018), corresponding to ≈±60 km/s from the systemic motion of Sgr dSph, and stars with parallaxes (π) within 3.0σ of π = 0.0 mas.
Among the bona fide Sgr stars, the spectroscopic targets were selected in a radial region outside the tidal radius of M54 (10.5″, Bellazzini et al. 2008, in order to avoid the contamination from cluster stars) within 60′ of the Sgr centre. Stars with G-band magnitude between 14.5 and 15.8 were considered, privileging stars in the bluer RGB of Sgr (see squared symbols in Fig. 1). We also excluded stars with bad photometric data, as traced by the Gaia quality parameter phot_bp_rp_excess_factor, according to Eq. (C.2) of Lindegren et al. (2018). Finally, to avoid contamination of the light collected by individual FLAMES fibres from (relatively) bright sources near our spectroscopic targets, we excluded stars of magnitude G* having a companion closer than 2.0″ and brighter than G = G* + 1.0.
Additionally, in order to sample the entire metallicity range covered by Sgr stars, we included in our sample 14 stars that mainly belong to the reddest RGB of the galaxy (the metal-rich, intermediate-age population; see the triangle symbols in Fig. 1), using archival spectra obtained under the programmes 71.B-0146 (PI: Bonifacio) and 081.D-286 (PI: Carretta). These spectra have been previously analysed in Monaco et al. (2005), Carretta et al. (2010), and Minelli et al. (2021), and here we present a new analysis with a homogeneous approach with respect to the new targets. The positions of all the spectroscopic targets in the Gaia DR3 colour-magnitude diagram of Sgr dSph are shown in Fig. 1.
The spectra were reduced with the dedicated ESO pipeline1 UVES pipeline version 6.1.8, which performs bias subtraction, flat-fielding, wavelength calibration, spectral extraction, and order merging. The individual exposures were sky-subtracted using the average spectrum of two close sky regions observed in the same fibre configuration. The final signal-to-noise ratio (S/N) per pixel at 6300 Å ranges from 20 to 40. Fig. 2 shows some examples of FLAMES-UVES spectra with different metallicity.
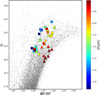 |
Fig. 1 Positions of the spectroscopic targets on the Gaia DR3 colourmagnitude diagram of Sgr dSph (only Sgr stars outside the tidal radius of M54 are shown), colour-coded according to their [Fe/H]. The triangles are the targets already discussed in Minelli et al. (2021), while the squares are the new targets. |
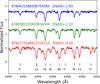 |
Fig. 2 Examples of spectra for three target stars with different [Fe/H]. Some lines of interest are labelled. |
3 Analysis
3.1 Atmospheric parameters
The effective temperature (Teff), the surface gravity (log g), and the microturbulence velocity (vt) were obtained using the Gaia DR3 photometry (Gaia Collaboration 2021). We first derived the dereddened Gaia magnitudes using the relation by Riello et al. (2021) and adopting the colour excess E(B - V) = 0.15 (Layden & Sarajedini 2000). The effective temperatures were obtained using the (BP - RP)0-Teff transformation by Mucciarelli et al. (2021). At the first step, Teff were computed assuming a metallicity of [Fe/H]=−1.5 dex for all the stars, then Teff were re-calculated adopting the appropriate metallicity of each target according to the results of the chemical analysis. Surface gravities were derived adopting the above Teff, a distance of D = 26.0 ± 1.3 kpc (Monaco et al. 2004), a stellar mass of 0.8 M⊙, and the G-band bolometric corrections obtained following the prescriptions by Andrae et al. (2018). Figure 3 shows the position of the spectroscopic targets in the Kiel Teff -log g diagram. The microturbulence velocities were derived using the relation by Mucciarelli & Bonifacio (2020) in order to avoid possible biases against the weak lines that can affect low S/N spectra and therefore the derived values of vt.
Uncertainties in Teff are dominated by the uncertainty in the adopted colour-Teff transformation (≈80 K; see Mucciarelli et al. 2021), while the contribution by photometry and reddening errors is less than 10 K. Uncertainties in logg are about 0.1, including the contribution of errors in the Teff adopted distance and stellar mass. The typical error on vt is 0.15 km/s, calculated by adding in quadrature the error on the log g with the error associated with the relation used.
3.2 Radial velocities
Heliocentric radial velocities (RVs) were measured with DAOSPEC (Stetson & Pancino 2008) using a list of unblended lines selected for the chemical analysis (see Section 3.3). This code automatically finds the centroid of spectral lines by Gaussian fitting and derives the final RV as the average value from the wavelength shifts of the measured lines. The associated uncertainties were computed as the standard deviation divided by the root mean square of the number of used lines. As presented in Fig. 4, the stars in our sample have RVs ranging from +119.4 to +158.9 km/s, consistent with the RV distribution of the Sgr stars (see e.g. Minelli et al. 2023) and confirming their membership to Sgr. The associated errors are generally of 0.1 km/s. The radial velocities are listed in Table A.1.
 |
Fig. 3 Kiel diagram showing the run of log g as a function of Teff for the Sgr spectroscopic targets (same symbols as in Fig. 1). |
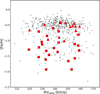 |
Fig. 4 Behaviour of [Fe/H] as a function of RV for the spectroscopic dataset discussed here (same symbols as in Fig. 1) in comparison with the sample of Sgr stars by Minelli et al. (2023). |
3.3 Line selection and spectral analysis
We derived the abundances of 21 species, namely O, Na, Mg, Al, Si, Ca, Sc, Ti, V, Cr, Mn, Fe, Co, Ni, Cu, Zn, Zr, Ba, La, Nd, and Eu2. All the abundances were derived with our own code SALVADOR performing a χ2 -minimization between observed line profiles and grids of synthetic spectra. The spectra were calculated with the code SYNTHE (Kurucz 2005) and we adopted model atmospheres calculated with the code ATLAS9 (Castelli & Kurucz 2003). We adopted the atomic and molecular linelist available in the R. L. Kurucz3 and F. Castelli4 websites, updated for some specific transitions with more recent or more accurate atomic data. In particular, we adopted new gf-values for Sc (Lawler et al. 2019), Ti (Lawler et al. 2013), V (Lawler et al. 2014), Ni (Wood et al. 2014), and Zn (Roederer & Lawler 2012). Hyperfine (or isotopic) splitting are included for all the Sc, V, Mn, Co, Cu, Ba, La, and Eu transitions. For each star, we selected a list of metallic transitions predicted to be unblended according to the observed spectral resolution and to the metallicity and stellar parameters of the target, following the iterative scheme described in Mucciarelli et al. (2023a). We privileged transitions with laboratory oscillator strengths. For Na abundances only, we applied corrections for non-local thermal equilibrium (NLTE) using the corrections grid by Lind et al. (2011).
The total uncertainty in each abundance ratio was computed by adding in quadrature the two main sources of errors, namely the error in the line fitting procedure and those arising from the stellar parameters. The uncertainty in the line fitting procedure was computed resorting to Monte Carlo simulations. For each star we created a set of 500 noisy synthetic spectra with a Pois-sonian noise level that reproduces the observed S/N, and the line fitting procedure was repeated. The dispersion of the abundance distribution obtained from these simulated spectra was assumed as the 1σ uncertainty. The abundance errors arising from the parameters were obtained by repeating the chemical analysis, varying each time one parameter by its 1σ uncertainty. We refer to Mucciarelli et al. (2013) and Minelli et al. (2021) for additional details about the uncertainty estimates.
4 Iron content
The sample of Sgr stars covers a range of [Fe/H] between −1.93 and −0.41 dex. Figure 1 shows the position of the targets in the Gaia DR3 colour-magnitude diagram colour-coded according to their [Fe/H]. While almost all the stars in this sample agree well with the colour-metallicity relation usually observed in Sgr (Bellazzini et al. 2008; Alfaro-Cuello et al. 2019; Vitali et al. 2022), three of them have much bluer colours than the bulk of the Sgr stars of the same metallicity ([Fe/H] 0.7/-0.6 dex) that lie on the red side of the RGB (see Fig. 5).
While metal-rich stars on the red side of the RGB should be old (−8−10 Gyr), stars with [Fe/H] ~ −0.7/−0.6 dex located on the blue side of the RGB should be significantly younger. Figure 5 shows some BaSTI-IAC isochrones (Pietrinferni et al. 2021) with [Fe/H] = −0.6 and −0.4 dex, solar-scaled chemical mixture and different ages. It is found that a metal-rich population with age −1−2 Gyr perfectly overlaps the blue side of the Sgr RGB, where three metal-rich Sgr stars are also located.
We can envisage two possible scenarios to explain the existence of these stars. The first scenario is that Sgr hosts a metal-rich ([Fe/H]−0.7/-0.6 dex) and young (−1−2 Gyr) population. This population should have had a distinct chemical enrichment path with respect to that of the dominant Sgr population of similar [Fe/H], with ages of 8-10 Gyr. This scenario implies the existence of a secondary branch of the Sgr age-metallicity relation, suggesting a higher level of complexity in the Sgr history than previously thought, for instance accretion of satellites (see e.g. Davies et al. 2024), or late gas infall or accretion triggering star formation (see e.g. Spitoni et al. 2022; Palla et al. 2024). We note that the age of this metal-rich population corresponds to the epoch when the gas was totally stripped (see e.g. Tepper-García & Bland-Hawthorn 2018). Such a metalrich young population should have a main sequence that clearly overlaps the extended blue plume of Sgr (Bellazzini et al. 2006) and probably it could be its dominant component. Alternatively, these stars are not genuine young stars, but are the product of mass-transfer in binary systems (see e.g. McCrea 1964). However, no sign of photometric or astrometric anomaly that can be connected to stellar multiplicity (e.g. the RUWE parameter ) is apparent in the Gaia DR3 catalogue.
In the following figures showing the measured abundance ratios, we highlight the position of these three targets. We have not found significant differences in the chemical composition of metal-rich stars located on the blue and red RGB, likely expected if these groups of stars have reached the same [Fe/H] on significantly different timescales. However, the small size of our sample and the relatively high abundance uncertainties highlight the need for further investigation (as supported also by observations in the Galaxy and the solar vicinity, where uncertainties reach much lower levels). The presence of these blue metal-rich stars surely deserves a deeper investigation.
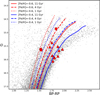 |
Fig. 5 Positions in the colour-magnitude diagram of the Sgr targets with [Fe/H]>-0.7 dex, superimposed on some BaSTI-IAC isochrones (Pietrinferni et al. 2021) with [Fe/H]=−0.6 and −0.4 dex solar-scaled chemical mixtures (red and blue curves, respectively) and ages of 1, 4, and 11 Gyr. |
5 The chemical composition of Sgr
Here we present a complete screening of the chemical composition5 of Sgr stars over a large [Fe/H] range. The metal-poor stars in the sample were selected to avoid contamination by the globular cluster M54. The presence of the latter stars in spectroscopic samples obtained in Sgr stellar nucleus does not allow us to unveil the real chemistry of this galaxy between [Fe/H]≃ −2 and −1 dex. Therefore, our selection criteria reveal the proper evolution of the progenitor of Sgr dSph.
In Figures 6-10, the abundance ratios of the Sgr targets are compared with the sample of Galactic GCs analysed by Mucciarelli et al. (2023b) adopting the same assumptions of this analysis (e.g. model atmospheres, atomic data for the used transitions, software for the analysis), thus providing the benchmark for a fully homogeneous comparison with the measures presented here. Only for the four elements involved in the anticorrelations phenomenon (namely O, Na, Mg, Al; see e.g. Gratton et al. 2004) did we consider for each cluster only the first-population stars. These stars have abundances that closely match those of MW field stars of similar metallicity, at variance with the second-generation stars whose abundances of these four elements reflect the internal chemical evolution of the clusters. For all the other elements we do not distinguish between firstand second-generation stars. In addition, we also show the MW field stars available in the SAGA database (Suda et al. 2008) that provide a representative (even if not homogeneous) reference for the overall chemical patterns over a large range of [Fe/H]. Despite possible systematics in the literature sample, it is useful to display the overall trends in the MW based on a large number of stars. However, the comparison between the chemical properties of Sgr and MW is based on this reference sample. Sgr stars exhibit, for most of the elements, trends with [Fe/H] that stand out from those of the MW stars. In the following, we provide the details of these trends for different families of elements (odd-Z, α, Fe-peak, and neutron-capture elements).
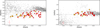 |
Fig. 6 Behaviour of [Na/Fe] and [Al/Fe] as a function of [Fe/H] for the Sgr spectroscopic targets of this study (same symbols as in Fig. 1), in comparison with the abundances of MW GCs analysed by Mucciarelli et al. (2023b, orange star symbols) and with the MW field stars from the SAGA database (Suda et al. 2008, grey circles). The empty red squares are the metal-rich Sgr targets belonging to the blue side of Sgr RGB (see Section 4). The typical errorbar of the abundance ratios measured for Sgr stars is shown in the bottom left corner. |
5.1 Odd-Z elements (Na and Al)
Sodium and aluminium are mostly produced in massive stars during hydrostatic C (and Ne, for Al) burning (Woosley & Weaver 1995). The production of these elements largely depends on stellar metallicity, as it needs neutron seeds that trace back to the nitrogen produced CNO cycle (e.g. Kobayashi et al. 2006). Moreover, a small (but non-negligible) contribution comes from lower-mass asymptotic giant branch (AGB) stars (see Smiljanic et al. 2016, and references therein).
The observed patterns for Na and Al are shown in Fig. 6. For Na the observed stars in Sgr dSph show a mildly increasing trend with metallicity. For [Fe/H] < −1 dex, the [Na/Fe] in Sgr stars closely matches that traced by first-generation MW GC stars and agrees with the theoretical expectations as more metallic massive stars exhibit larger Na yields. Such a trend is instead only partly seen in MW field stars, where the average trend shows an upturn only for [Fe/H] ≃ −1.5 dex and generally higher [Na/Fe] values (see also Smiljanic et al. 2016, their Figure 8, left panel). This offset between Sgr/MW GC stars and the MW field stars could be explained by the different NLTE corrections (because the Na abundances are significantly affected by the departures from LTE, even at the metallicity of our targets), with the first sample including the corrections by Lind et al. (2011), while the second sample includes different (or lacking) NLTE corrections.
At [Fe/H] ≃ −1 dex, the [Na/Fe] in Sgr remains low, while in MW field stars and in 47 Tucanae (the most metal-rich GC in our reference sample) there is an increase in this abundance ratio. This can be attributed to SNe Ia pollution, which in Sgr starts to become effective at lower metallicity than in the MW. However, in the metallicity range covered by our sample stars, we observe a large scatter in [Na/Fe], which cannot be explained in the light of typical abundance uncertainties. This scatter might reflect multiple sites of Na production, coupled to inhomogeneous chemical enrichment. Similarly large [Na/Fe] scatters have been observed in other MW satellites, i.e. the Large Magellanic Cloud (LMC Pompéia et al. 2008; Van der Swaelmen et al. 2013; Minelli et al. 2021), the Small Magellanic Cloud (SMC Mucciarelli et al. 2023a), and Fornax (Letarte et al. 2010).
For Al, the trend at lower metallicities ([Fe/H]< −1 dex) remains quite similar to what is seen in the MW (especially for GCs, as field stars are lacking in the range −2 <[Fe/H]/dex< −1). However, we note that an increasing [Al/Fe] trend is not observed or, at least, it is hidden in the scatter-plot. For higher metal-licities, we instead see an evident downturn that detaches the Al trend observed in Sgr from that in the MW (see, however, Smiljanic et al. 2016, their Figure 8, right panel, showing a prominent downturn in MW Gaia-ESO data). Both the nonincreasing trend at low metallicities and the decreasing trend for the most metallic Sgr stars can be easily explained in the context of the time-delay model (e.g. Matteucci & Brocato 1990; Matteucci 2012, 2021, see also Sect. 5.2), in which the relative contribution from SNe Ia to the ISM pollution is more prominent at lower metallicities in dwarf galaxies (such as Sgr) relative to actively star-forming galaxies, such as the MW. Our results for Na and Al are compatible with those obtained by Vitali et al. (2025) in a similar [Fe/H] range. On the other hand, Hasselquist et al. (2021) found [Al/Fe] around ~-0.5 dex at any metallic-ity (see Fig. B.1). The origin of this discrepancy is not clear and might be due to some relevant systematics between optical and near-infrared Al lines. These systematics among different diagnostics can also affect other elements.
5.2 α-elements
The α-elements are produced mainly in massive stars, and are usually grouped in elements produced during hydrostatic and explosive burnings. O and Mg belong to the first class and are almost completely produced in massive stars (see e.g. Romano et al. 2010; Palla et al. 2022), while Si, Ca, and Ti are produced through explosive nucleosynthesis with a minor but not negligible contribution by SNe Ia (see e.g. Seitenzahl & Townsley 2017; Kobayashi et al. 2020a). In some seminal papers (Tinsley 1979; Matteucci & Greggio 1986; Matteucci & Brocato 1990), the [α/Fe] abundance ratios have been recognized as a diagnostic sensitive to the star formation efficiency of the system, owing to the different timescales of enrichment by CC-SNe and SNe Ia. All the [α/Fe] ratios in our sample of Sgr stars show decreasing trends by increasing [Fe/H]. The most metal-poor Sgr stars have enhanced [α/Fe] ratios comparable with those measured in the GCs of the reference sample. Both Sestito et al. (2024) and Ou et al. (2025) found similar enhanced values for Sgr stars with [Fe/H]<-2.5 dex.
The metallicity of the α-knee (corresponding to the metal-licity where the contribution of SNe Ia starts to lower the [α/Fe] ratios significantly) is around [Fe/H]~ −1.5/-1.3 dex, as clearly visible in the case of oxygen, which exhibits the cleanest trend. Vitali et al. (2025) attempt to constrain the position of the knee using data from various studies and propose a value of [Fe/H]= −1.05 dex, while highlighting some weaknesses of this value (statistics, data quality, and heterogeneity in analyses). Our [Mg/Fe], [Si/Fe], and [Ca/Fe] abundance ratios closely match those obtained by Hasselquist et al. (2021); the only discrepancy is in the [Mg/Fe] of the metal-poor stars, where APOGEE provides [Mg/Fe] values lower by ~0.2 dex than our results (see Fig. B.1). As for Al, also for these elements possible systematics between optical and near-infrared lines can affect the abundances.
The behaviour that we found is consistent with the lower star formation efficiency of Sgr (Mucciarelli et al. 2017) compared to the MW galaxy. The different panels of Figure 7 show that both MW GC and field stars exhibit a plateau in [α/Fe] ratios extending up to higher metallicities ([Fe/H]−1 dex). This is indicative of higher star formation efficiency, and is explained by a larger number of prompt sources (i.e. CC-SNe) polluting the ISM before SNe Ia start to be effective.
Finally, Fig. 8 compares the average value of the hydrostatic α-elements of the Sgr stars with the abundance patterns observed in other dwarf galaxies in the Local Group, i.e. LMC (Lapenna et al. 2012; Van der Swaelmen et al. 2013), SMC (Mucciarelli et al. 2023a), Fornax (Letarte et al. 2010), and Sculptor (Hill et al. 2019). The trend defined by Sgr stars nicely matches that drawn by the Magellanic Clouds stars, especially for the most metalrich range and in the flat metal-poor branch, which is absent in lower mass dwarfs. This suggests a similar chemical enrichment history between Sgr and these irregular galaxies, with the match in the range [Fe/H] ≥ −0.8 suggesting that the mass of the Sgr progenitor may have been comparable with that of the LMC, as already suggested by other studies (de Boer et al. 2015; Gibbons et al. 2017; Johnson et al. 2020; Minelli et al. 2021). On the other hand, the α-sequence of Sgr stars is clearly different to that of dwarf spheroidal galaxies such as Sculptor or Fornax, indicating a more intense chemical enrichment compared to these galaxies.
5.3 Iron-peak elements
The iron-peak group includes elements formed from different nucleosynthesis paths, i.e. mainly massive stars (e.g. Sc, Cu, Zn), SNe Ia (e.g. Mn, Ni), or a mix of both (e.g. V, Cr, Co). The trends observed in Sgr dSph for this group of elements are shown in Fig. 9. Several of these elements (Sc, Co, Mn, Ni, Zn, Cu) show quite different chemical evolution pathways relative to what is observed in the Galaxy.
While for Sc and Co our theoretical knowledge is quite limited due to the pathological underestimation by models of observed trends across metallicities (Romano et al. 2010; Kobayashi et al. 2020a), for Mn, Ni, Zn, and Cu (elements not included in studies based on APOGEE nor in the sample by Vitali et al. 2025) several comments can be made in the light of the different nucleosynthetic patterns exhibited by different progenitor sources.
Manganese is mainly produced by SNe Ia (Romano et al. 2010; Kobayashi et al. 2020a; Palla 2021). The rise of [Mn/Fe] with increasing [Fe/H] reflects the small amount of Mn produced in massive stars and the subsequent contribution by SN Ia (which also increases with metallicity). In Sgr, [Mn/Fe] behaves similarly, but with a generally higher level of abundance for [Fe/H] < −1 dex and a slower increase at higher metallicities relative to the MW. Before the onset of SNe Ia the production of Mn is driven by CC-SNe, with the hypernovae6 (HNe) invoked to explain the very low [Mn/Fe] value at low metallici-ties (Kobayashi et al. 2006; Romano et al. 2010). Here the higher [Mn/Fe] level in Sgr at low metallicities, namely at [Fe/H] below that of the α-knee (see Sect. 5.2), relative to the MW seems to suggest a lower contribution by HNe in Sgr.
Nickel is also produced in very important amounts by SNe Ia (Leung & Nomoto 2018, 2020; Kobayashi et al. 2020b; Palla 2021). Several studies have pointed out that Ni is sensitive to the white dwarf progenitors of SN Ia (see e.g. Figs. 10 and 11 in Kobayashi et al. 2020b), namely of near- and sub-Chandrasekhar masses (near-MCh and sub-MCh): the former produce a large amount of Ni and the latter provide sub-solar Ni abundances (see Fig. 4 in Palla 2021). The trends in Figure 9 show that in the MW, [Ni/Fe] exhibits a solar and constant value over the entire range of metallicities, which suggest a concurrent contribution by different near-MCh and sub-MCh SNe Ia progenitors (Palla 2021).
On the other hand, Sgr stars show a decrease in [Ni/Fe] from solar (MW-like) values down to ~-0.4 dex; the drop starts at the metallicity of the α-knee, i.e. at [Fe/H]–1.5 dex. A similar but less steep trend is also found by Hasselquist et al. (2021) (see Fig. B.1). This trend suggests a larger contribution of subChandrasekhar mass SNe Ia in Sgr relative to the MW, providing a lower amount of Ni with respect to the produced Fe. This trend is also in agreement with what is seen in Figure 9 for Mn, but with a shallower rise in [Mn/Fe] observed in Sgr relative to the MW. In fact, Mn has a similar nucleosynthetic pattern to Ni in different SNe Ia progenitors: near-MCh progenitors are more likely to produce Mn relative to sub-MCh progenitors. In general, it is worth noting that most of the classical dSphs display evidence that the dominant explosion mechanism of SNe Iain these galaxies arises from sub-MCh progenitors (Kirby et al. 2019; de los Reyes et al. 2020). Therefore, Sgr trends perfectly fit within this scenario.
The element zinc is theoretically explained by a predominant production by HNe. As this is associated with stars with very high initial stellar mass (≥20 M⊙), [Zn/Fe] can be a powerful tracer of the contribution of very massive stars and of an initial mass function (IMF) skewed against massive stars in galaxies experiencing inefficient star formation (see e.g. Jeřábková et al. 2018). Figure 9 shows that Sgr stars exhibit a strong decline of [Zn/Fe] with increasing [Fe/H], moving from sub-solar values at low metallicity, already slightly lower than those measured in MW stars, down to almost [Zn/Fe]–1 dex in the most metalrich stars. This very steep decline can be explained as being due to the contribution of SNe Ia (which do not contribute to Zn production) combined with a much lower pollution by very energetic events from massive stars as HNe, which also explains the lower level of the plateau at low metallicities. It is worth noting that such a trend is consistent both with the theoretical explanation proposed above for Mn and with the [Zn/Fe] trends observed in other MW satellites. In fact, [Zn/Fe] similarly drops in the most metal-rich field stars of Sculptor dSph (Skúladóttir et al. 2017) and in the globular clusters of the SMC (Mucciarelli et al. 2023b). This may indicate some level of deficiency of very massive stars in these dwarfs, and therefore the prevalence of a top-light IMF in systems that experience a low level of star formation activity. Finally, we highlight a large star-to-star scatter in [Zn/Fe]. This scatter is compatible with the high uncertainties in this abundance ratio due to the continuum location around the only available Zn transition at 4810 Å that is located in the bluest part of the adopted UVES set-up where the S/N drops significantly (S/N~10-20).
The last element in this group for which we note interesting differences in the observed trends is copper (see Figure 9 bottom left panel). To derive the copper abundance we use the line at λ = 5105 Å, which starts to be saturated in the spectra of cool giants for [Fe/H]>-1 dex. Therefore, for most of the metal-rich stars in our sample the Cu line at 5105 Å is not sensitive enough to abundance variations to derive reliable abundance values. For the other stars, Sgr exhibits [Cu/Fe] abundances that are significantly sub-solar with a mild enhancement with increasing metallicity, that highly consistently resembles the theoretical behaviour expected for this element, whose production is favoured in the presence of more metal seeds. Copper is mainly produced from stars with M ≳ 8 M⊙ through the weak slow neutron-capture process (Romano & Matteucci 2007; Prantzos et al. 2018). The measured lower [Cu/Fe] values possibly suggest a lower contribution by massive stars to the chemical enrichment of Sgr, in agreement with Mn and Zn trends. This behaviour resembles that observed in Omega Centauri (Cunha et al. 2002), in the LMC (Van der Swaelmen et al. 2013), and in the SMC (Mucciarelli et al. 2023a).
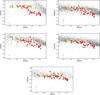 |
Fig. 7 α-elements (O, Mg, Si, Ca, and Ti) abundance ratios as a function of [Fe/H]. The symbols are the same as in Fig. 6. |
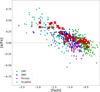 |
Fig. 8 Behaviour of the average hydrostatic [α/Fe] as a function of [Fe/H] for the Sgr stars (same symbols as in Fig. 7) in comparison with stars of the LMC (Van der Swaelmen et al. 2013; Lapenna et al. 2012), the SMC(Mucciarelli et al. 2023a), Fornax (Letarte et al. 2010), and Sculptor (Hill et al. 2019). The [α/Fe] is computed by averaging [O/Fe] and [Mg/Fe]. |
5.4 Slow neutron-capture elements
The derived abundance ratios for Zr, Ba, La, and Nd as a function of [Fe/H] are shown in Fig. 10. These elements are mainly produced through the slow neutron-capture process (hereafter s-process) in stars with different ranges of masses. In particular, Zr is significantly produced in both massive stars through the weak s-process and in AGB stars over a wide range of mass values (see also Prantzos et al. 2018). On the other hand, Ba, La, and Nd are produced in AGB stars with masses lower than ~3-4 M⊙ (Gallino et al. 1998; Busso et al. 1999; Cristallo et al. 2015). Moreover, at low metallicities a significant contribution to the element budget is brought by the rapid neutron-capture process (hereafter r-process, Truran 1981), which occurs in rare and energetic events such as neutron star mergers or peculiar classes of CC-SNe (see Section 5.5). This contribution is particularly relevant for Nd, for which different studies (e.g. Sneden et al. 2008; Prantzos et al. 2020) attribute up to 40% of the r-process contribution.
In Figure 10, the Sgr stars display values for these abundance ratios that are compatible with those in the MW control sample at low to intermediate metallicity, with a significant increase at [Fe/H] > −0.7 dex. In particular, Ba, La, and Nd abundances reach values of about +1 dex. This value is reached following a clear trend at high metallicities, which in turn should exclude that these abundances are only the effect of AGB mass transfer in binary systems (Ba or CH stars, see Cseh et al. 2018; Stancliffe 2021). The large increase in [s/Fe] ratios can be attributed to a major contribution from low- to intermediatemass stars to the late chemical enrichment in the Sgr, which can be originated by a galaxy-wide IMF skewed towards lower masses relative to the canonical IMF adopted for the MW field (Kroupa et al. 1993). Though the large theoretical uncertainties still residing in the nucleosynthesis of these elements prevent us from drawing clear conclusions, we note that the above findings are consistent with those obtained from the analysis of the behaviour of other key IMF tracers (most notably Mn and Zn; see Sect. 5.3).
For Zr instead, a constant and decreasing trend is observed at high metallicities, basically following the Galactic pattern. This is due to the different types of progenitors for this element. Massive stars contribute less to the chemical enrichment of Sgr relative to the Galaxy, thus cancelling the greater contribution by low- to intermediate-mass stars.
5.5 Rapid neutron-capture elements
R-process elements (e.g. Eu measured in our sample) are thought to be produced by peculiar classes of CC-SNe, for example collapsars (e.g. Siegel et al. 2019) and proto-magnetars and/or magneto-rotational SNe (MRD-SNe, e.g. Winteler et al. 2012; Nishimura et al. 2015), and by neutron stars mergers (NSM, Lattimer & Schramm 1974; Argast & Samland 2004; Matteucci et al. 2014). The latter occur following a delay time distribution (similarly to SNe Ia), and therefore on longer timescales relative to CC-SNe; they are rare events, but very efficient in producing r-process elements, as suggested by the large star-to-star scatter observed among the Milky Way metal-poor stars (e.g. Cescutti et al. 2015). However, different studies agree on the need for a mixture of prompt source (i.e. CC-SNe type) and NSM to reproduce the Galactic [Eu/Fe] distribution (Côté et al. 2019; Molero et al. 2023).
The trend of [Eu/Fe] with metallicity in Sgr stars (bottom panel of Figure 10) resembles that observed in the MW, with enhanced [Eu/Fe] values for [Fe/H] ≲ −1.2/-1.0 dex and a subsequent decrease at higher metallicities, due to the onset of SNe Ia that do not produce r-process elements. However, it is worth noting that, despite a large star-to-scatter, the metal-poor Sgr stars have [Eu/Fe] values that are systematically higher by ~0.25 dex than the [Eu/Fe] measured in the MW reference clusters. Moreover, the plateau in the [Eu/Fe] abundances is slightly more extended towards higher metallicity relative to the value for α-elements. While our stars show enhanced [Eu/Fe] at any metallicity, Sestito et al. (2024) and Ou et al. (2025) provide contradictory results concerning the metal-poor regime, Sestito et al. (2024) found solar [Eu/Fe] values for all their targets (five with [Fe/H]<-2.2 dex and one with [Fe.H]–1.2 dex), while the sample of Ou et al. (2025) exhibits a large star-to-star scatter, comparable to that observed in MW stars at similar [Fe/H] and attributed to the stochastic nature of the production sites of r-process elements. Despite the different metallicity ranges, our results better agree with those by Ou et al. (2025), in particular regarding the significant star-to-star scatter in [Eu/Fe]. However, it could be interesting to understand the origin of the discrepancy between Sestito et al. (2024) and Ou et al. (2025).
The trend shown in Figure 10 highlights that Sgr is characterized by a very efficient r-process production, more efficient than is observed in the Galaxy. This is also observed in several galaxies of the Local Group, i.e. the SMC (Mucciarelli et al. 2023b), the LMC (Mucciarelli et al. 2008; Van der Swaelmen et al. 2013), and classical dwarf spheroidal galaxies (Letarte et al. 2010; Reichert et al. 2020). This feature of extragalactic stars has also been highlighted in the comparison of the MW halo in situ and accreted stars and clusters (Ernandes et al. 2024; Monty et al. 2024), where the latter exhibit higher [Eu/α] values. Therefore, the results of this work support the idea of a strong efficiency of r-process production in MW satellites.
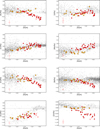 |
Fig. 9 Behaviour of [Sc/Fe], [V/Fe], [Cr/Fe], and [Mn/Fe] as a function of [Fe/H]. The symbols are the same as in Fig. 6. |
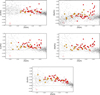 |
Fig. 10 Behaviour of [Zr/Fe], [Ba/Fe], [La/Fe], [Nd/Fe], and [Eu/Fe] as a function of [Fe/H]. The symbols are the same as in Fig. 6. |
6 Conclusions
In this work we described the chemical abundances of stars in the main body of Sgr dSph in the metallicity range −2.0 < [Fe/H] < −0.4 dex via high-resolution spectroscopy. The chemical composition of this sample was compared with the abundance ratios of MW GCs analysed with the same assumptions used for the analysis of Sgr stars; this minimized the systematics affecting the comparison between different chemical analyses.
In the analysed [Fe/H] range we were able to identify the transition between the enrichment phase dominated by CC-SNe and that dominated by SNe Ia. In particular, the [α/Fe] ratios suggest an α-knee occurring at about [Fe/H]~ −1.5/-1.3 dex, compatible with the lower star formation efficiency of this galaxy relative to the MW (Mucciarelli et al. 2017) in the context of the time-delay model (e.g. Matteucci 2012).
At lower metallicities, Sgr stars exhibit a chemical composition compatible with MW stars of similar [Fe/H]. The only relevant exceptions are [Mn/Fe], [Zn/Fe], and [Eu/Fe], which respectively display higher (Mn, Eu) and lower (Zn) ratios than in MW stars. Instead, at higher [Fe/H] the chemical patterns of Sgr significantly deviate from those of the MW for almost all the elements considered in this study. This transition start at [Fe/H]~ −1.5/−1.3 dex, in agreement with the knee observed for the α-elements.
In general, the abundance patterns of Sgr stars point to a lower contribution by massive stars (in particular, those exploding as HNe, as revealed by [Zn/Fe] and [Mn/Fe]), a higher contribution by sub-Chandrasekhar progenitors of SNe Ia (as revealed by [Ni/Fe] and [Mn/Fe]), and a high production efficiency of neutron-capture elements, both r-process ([Eu/Fe]) at low metallicities and s-process ([Ba, La, Nd/Fe]) at high metallicities. All these findings are in line with the individual elemental trends observed in other dwarf MW satellites (e.g. Kirby et al. 2019; Reichert et al. 2020; Mucciarelli et al. 2023b). We highlighted the importance of deriving abundances for some key elements that have not received the attention they deserve, for instance Mn, Ni, and Zn. Moreover, this study highlights the importance of pursuing the goal of a complete (in metallicity) and homogeneous (in derivation) sampling of the different elemental abundance patterns in these galaxies. It is only in this way that one can hope to break the degeneracies that affect the interpretation of the origin of the observed patterns, leading to a confirmation (or rejection) of our theoretical expectations.
Data availability
Table A.1 and the table with the chemical abundances are available at the CDS via anonymous ftp to cdsarc.cds.unistra.fr (130.79.128.5) or via https://cdsarc.cds.unistra.fr/viz-bin/cat/J/A+A/699/A356.
Acknowledgements
We thank the anonymous referee for useful comments and suggestions, and P. Bonifacio, E. Caffau and D. Hatzidimitriou for their help and suggestions. A.M., M.B., M.P. and D.R. acknowledge support from the project “LEGO - Reconstructing the building blocks of the Galaxy by chemical tagging” (PI: A. Mucciarelli). granted by the Italian MUR through contract PRIN 2022LLP8TK_001. This project has received funding from the European Union’s Horizon 2020 research and innovation programme under the Marie Sklodowska-Curie grant agreement No 101072454, as part of the Milky Way-Gaia Doctoral Network (https://www.mwgaiadn.eu/). Funded by the European Union (ERC-2022-AdG, “StarDance: the non-canonical evolution of stars in clusters”, Grant Agreement 101093572, PI: E. Pancino). Views and opinions expressed are however those of the author(s) only and do not necessarily reflect those of the European Union or the European Research Council. Neither the European Union nor the granting authority can be held responsible for them. This work has made use of data from the European Space Agency (ESA) mission Gaia (https://www.cosmos.esa.int/gaia), processed by the Gaia Data Processing and Analysis Consortium (DPAC, https://www.cosmos.esa.int/web/gaia/dpac/consortium). Funding for the DPAC has been provided by national institutions, in particular the institutions participating in the Gaia Multilateral Agreement.
Appendix A Tables
Sagittarius spectroscopic targets: photometric data, atmospheric parameters, [Fe/H], and RVs.
Appendix B Comparison with Hasselquist et al. (2021)
The [Mg/Fe], [Al/Fe], [Si/Fe], [Ca/Fe], and [Ni/Fe] abundance ratios measured in this study were compared with those obtained by the H-band spectra of the APOGEE survey discussed by Hasselquist et al. (2021). Because the Hasselquist et al. (2021) sample includes also Sgr stars located in the streams, for this comparison we consider only Sgr stars outside the tidal radius of M54 (in order to avoid the contamination from cluster stars) and within 60’ of the Sgr centre, similar to the spatial region where our targets are located.
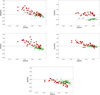 |
Fig. B.1 Comparison between this study (red symbols) and Hasselquist et al. (2021, green circles). |
References
- Alard, C. 2001, A&A, 377, 389 [NASA ADS] [CrossRef] [EDP Sciences] [Google Scholar]
- Alfaro-Cuello, M., Kacharov, N., Neumayer, N., et al. 2019, ApJ, 886, 57 [Google Scholar]
- Andrae, R., Fouesneau, M., Creevey, O., et al. 2018, A&A, 616, A8 [NASA ADS] [CrossRef] [EDP Sciences] [Google Scholar]
- Argast, D., & Samland, M. 2004, PASA, 21, 161 [Google Scholar]
- Bellazzini, M., Ferraro, F. R., & Buonanno, R. 1999, MNRAS, 304, 633 [Google Scholar]
- Bellazzini, M., Newberg, H. J., Correnti, M., Ferraro, F. R., & Monaco, L. 2006, A&A, 457, L21 [NASA ADS] [CrossRef] [EDP Sciences] [Google Scholar]
- Bellazzini, M., Ibata, R. A., Chapman, S., et al. 2008, AJ, 136, 1147 [Google Scholar]
- Busso, M., Gallino, R., & Wasserburg, G. J. 1999, ARA&A, 37, 239 [Google Scholar]
- Carlin, J. L., Majewski, S. R., Casetti-Dinescu, D. I., et al. 2012, ApJ, 744, 25 [NASA ADS] [CrossRef] [Google Scholar]
- Carretta, E., Bragaglia, A., Gratton, R. G., et al. 2010, ApJ, 714, L7 [Google Scholar]
- Castelli, F., & Kurucz, R. L. 2003, A&A, 210, A20 [NASA ADS] [Google Scholar]
- Cescutti, G., & Matteucci, F. 2022, Universe, 8, 173 [NASA ADS] [CrossRef] [Google Scholar]
- Cescutti, G., Romano, D., Matteucci, F., Chiappini, C., & Hirschi, R. 2015, A&A, 577, A139 [NASA ADS] [CrossRef] [EDP Sciences] [Google Scholar]
- Côté, B., Eichler, M., Arcones, A., et al. 2019, ApJ, 875, 106 [Google Scholar]
- Cristallo, S., Straniero, O., Piersanti, L., & Gobrecht, D. 2015, ApJS, 219, 40 [Google Scholar]
- Cseh, B., Lugaro, M., D’Orazi, V., et al. 2018, A&A, 620, A146 [NASA ADS] [CrossRef] [EDP Sciences] [Google Scholar]
- Cunha, K., Smith, V. V., Suntzeff, N. B., et al. 2002, AJ, 124, 379 [NASA ADS] [CrossRef] [Google Scholar]
- Davies, E. Y., Monty, S., Belokurov, V., & Dillamore, A. M. 2024, MNRAS, 529, 772 [NASA ADS] [CrossRef] [Google Scholar]
- De Boer, T., Belokurov, V., Beers, T., & Lee, Y. 2014, MNRAS, 443, 658 [NASA ADS] [CrossRef] [Google Scholar]
- de Boer, T. J. L., Belokurov, V., & Koposov, S. 2015, MNRAS, 451, 3489 [Google Scholar]
- de los Reyes, M. A. C., Kirby, E. N., Seitenzahl, I. R., & Shen, K. J. 2020, ApJ, 891, 85 [NASA ADS] [CrossRef] [Google Scholar]
- Ernandes, H., Feuillet, D., Feltzing, S., & Skúladóttir, Á. 2024, A&A, 691, A333 [NASA ADS] [CrossRef] [EDP Sciences] [Google Scholar]
- Gaia Collaboration (Prusti, T., et al.) 2016, A&A, 595, A1 [NASA ADS] [CrossRef] [EDP Sciences] [Google Scholar]
- Gaia Collaboration (Helmi, A., et al.) 2018, A&A, 616, A12 [NASA ADS] [CrossRef] [EDP Sciences] [Google Scholar]
- Gaia Collaboration (Brown, A. G. A., et al.) 2021, A&A, 649, A1 [NASA ADS] [CrossRef] [EDP Sciences] [Google Scholar]
- Gallino, R., Arlandini, C., Busso, M., et al. 1998, ApJ, 497, 388 [Google Scholar]
- Gibbons, S., Belokurov, V., & Evans, N. 2017, MNRAS, 464, 794 [NASA ADS] [CrossRef] [Google Scholar]
- Gratton, R., Sneden, C., & Carretta, E. 2004, ARA&A, 42, 385 [Google Scholar]
- Hansen, C. J., El-Souri, M., Monaco, L., et al. 2018, ApJ, 855, 83 [NASA ADS] [CrossRef] [Google Scholar]
- Hasselquist, S., Hayes, C. R., Lian, J., et al. 2021, ApJ, 923, 172 [NASA ADS] [CrossRef] [Google Scholar]
- Hayes, C. R., Majewski, S. R., Hasselquist, S., et al. 2020, ApJ, 889, 63 [Google Scholar]
- Hill, V., Skúladóttir, Á., Tolstoy, E., et al. 2019, A&A, 626, A15 [NASA ADS] [CrossRef] [EDP Sciences] [Google Scholar]
- Ibata, R., Gilmore, G., & Irwin, M. 1994, Nature, 370, 194 [NASA ADS] [CrossRef] [Google Scholar]
- Ibata, R., Bellazzini, M., Thomas, G., et al. 2020, ApJ, 891, L19 [NASA ADS] [CrossRef] [Google Scholar]
- Jeřábková, T., Hasani Zonoozi, A., Kroupa, P., et al. 2018, A&A, 620, A39 [Google Scholar]
- Johnson, B. D., Conroy, C., Naidu, R. P., et al. 2020, ApJ, 900, 103 [NASA ADS] [CrossRef] [Google Scholar]
- Kirby, E. N., Xie, J. L., Guo, R., et al. 2019, ApJ, 881, 45 [NASA ADS] [CrossRef] [Google Scholar]
- Kobayashi, C., Umeda, H., Nomoto, K., Tominaga, N., & Ohkubo, T. 2006, ApJ, 653, 1145 [NASA ADS] [CrossRef] [Google Scholar]
- Kobayashi, C., Karakas, A. I., & Lugaro, M. 2020a, ApJ, 900, 179 [Google Scholar]
- Kobayashi, C., Leung, S.-C., & Nomoto, K. 2020b, ApJ, 895, 138 [CrossRef] [Google Scholar]
- Kroupa, P., Tout, C. A., & Gilmore, G. 1993, MNRAS, 262, 545 [NASA ADS] [CrossRef] [Google Scholar]
- Kurucz, R. L. 2005, Mem. Soc. Astron. It. Suppl., 8, 14 [Google Scholar]
- Lapenna, E., Mucciarelli, A., Origlia, L., & Ferraro, F. R. 2012, ApJ, 761, 33 [NASA ADS] [CrossRef] [Google Scholar]
- Laporte, C. F., Johnston, K. V., & Tzanidakis, A. 2019, MNRAS, 483, 1427 [Google Scholar]
- Lattimer, J. M., & Schramm, D. N. 1974, ApJ, 192, L145 [NASA ADS] [CrossRef] [Google Scholar]
- Lawler, J. E., Guzman, A., Wood, M. P., Sneden, C., & Cowan, J. J. 2013, ApJS, 205, 11 [Google Scholar]
- Lawler, J. E., Wood, M. P., Den Hartog, E. A., et al. 2014, ApJS, 215, 20 [CrossRef] [Google Scholar]
- Lawler, J. E., Hala, Sneden, C., et al. 2019, ApJS, 241, 21 [NASA ADS] [CrossRef] [Google Scholar]
- Layden, A. C., & Sarajedini, A. 2000, AJ, 119, 1760 [NASA ADS] [CrossRef] [Google Scholar]
- Letarte, B., Hill, V., Tolstoy, E., et al. 2010, A&A, 523, A17 [NASA ADS] [CrossRef] [EDP Sciences] [Google Scholar]
- Leung, S.-C., & Nomoto, K. 2018, ApJ, 861, 143 [Google Scholar]
- Leung, S.-C., & Nomoto, K. 2020, ApJ, 888, 80 [Google Scholar]
- Lind, K., Asplund, M., Barklem, P. S., & Belyaev, A. 2011, A&A, 528, A103 [NASA ADS] [CrossRef] [EDP Sciences] [Google Scholar]
- Lindegren, L., Hernández, J., Bombrun, A., et al. 2018, A&A, 616, A2 [NASA ADS] [CrossRef] [EDP Sciences] [Google Scholar]
- Majewski, S. R., Skrutskie, M., Weinberg, M. D., & Ostheimer, J. C. 2003, ApJ, 599, 1082 [NASA ADS] [CrossRef] [Google Scholar]
- Matteucci, F. 2012, Chemical Evolution of Galaxies (Berlin: Springer) [Google Scholar]
- Matteucci, F. 2021, A&A Rev., 29, 5 [NASA ADS] [CrossRef] [Google Scholar]
- Matteucci, F., & Brocato, E. 1990, ApJ, 365, 539 [CrossRef] [Google Scholar]
- Matteucci, F., & Greggio, L. 1986, A&A, 154, 279 [NASA ADS] [Google Scholar]
- Matteucci, F., Romano, D., Arcones, A., Korobkin, O., & Rosswog, S. 2014, MNRAS, 438, 2177 [Google Scholar]
- McCrea, W. H. 1964, MNRAS, 128, 147 [Google Scholar]
- McWilliam, A., Wallerstein, G., & Mottini, M. 2013, ApJ, 778, 149 [NASA ADS] [CrossRef] [Google Scholar]
- Minelli, A., Mucciarelli, A., Romano, D., et al. 2021, ApJ, 910, 114 [CrossRef] [Google Scholar]
- Minelli, A., Bellazzini, M., Mucciarelli, A., et al. 2023, A&A, 669, A54 [NASA ADS] [CrossRef] [EDP Sciences] [Google Scholar]
- Molero, M., Magrini, L., Matteucci, F., et al. 2023, MNRAS, 523, 2974 [NASA ADS] [CrossRef] [Google Scholar]
- Monaco, L., Bellazzini, M., Ferraro, F., & Pancino, E. 2004, MNRAS, 353, 874 [NASA ADS] [CrossRef] [Google Scholar]
- Monaco, L., Bellazzini, M., Bonifacio, P., et al. 2005, A&A, 441, 141 [NASA ADS] [CrossRef] [EDP Sciences] [Google Scholar]
- Monaco, L., Bellazzini, M., Bonifacio, P., et al. 2007, A&A, 464, 201 [NASA ADS] [CrossRef] [EDP Sciences] [Google Scholar]
- Monty, S., Belokurov, V., Sanders, J. L., et al. 2024, MNRAS, 533, 2420 [NASA ADS] [CrossRef] [Google Scholar]
- Mucciarelli, A., & Bonifacio, P. 2020, A&A, 640, A87 [NASA ADS] [CrossRef] [EDP Sciences] [Google Scholar]
- Mucciarelli, A., Carretta, E., Origlia, L., & Ferraro, F. R. 2008, AJ, 136, 375 [NASA ADS] [CrossRef] [Google Scholar]
- Mucciarelli, A., Bellazzini, M., Catelan, M., et al. 2013, MNRAS, 435, 3667 [NASA ADS] [CrossRef] [Google Scholar]
- Mucciarelli, A., Bellazzini, M., Ibata, R., et al. 2017, A&A, 605, A46 [NASA ADS] [CrossRef] [EDP Sciences] [Google Scholar]
- Mucciarelli, A., Bellazzini, M., & Massari, D. 2021, A&A, 653, A90 [NASA ADS] [CrossRef] [EDP Sciences] [Google Scholar]
- Mucciarelli, A., Minelli, A., Bellazzini, M., et al. 2023a, A&A, 671, A124 [NASA ADS] [CrossRef] [EDP Sciences] [Google Scholar]
- Mucciarelli, A., Minelli, A., Lardo, C., et al. 2023b, A&A, 677, A61 [NASA ADS] [CrossRef] [EDP Sciences] [Google Scholar]
- Nishimura, N., Takiwaki, T., & Thielemann, F.-K. 2015, ApJ, 810, 109 [Google Scholar]
- Nomoto, K., Kobayashi, C., & Tominaga, N. 2013, ARA&A, 51, 457 [CrossRef] [Google Scholar]
- Ou, X., Yelland, A., Chiti, A., et al. 2025, AJ, 169, 279 [Google Scholar]
- Palla, M. 2021, MNRAS, 503, 3216 [Google Scholar]
- Palla, M., Santos-Peral, P., Recio-Blanco, A., & Matteucci, F. 2022, A&A, 663, A125 [NASA ADS] [CrossRef] [EDP Sciences] [Google Scholar]
- Palla, M., Magrini, L., Spitoni, E., et al. 2024, A&A, 690, A334 [NASA ADS] [CrossRef] [EDP Sciences] [Google Scholar]
- Pasquini, L., Avila, G., Blecha, A., et al. 2002, The Messenger, 110, 1 [Google Scholar]
- Pietrinferni, A., Hidalgo, S., Cassisi, S., et al. 2021, ApJ, 908, 102 [NASA ADS] [CrossRef] [Google Scholar]
- Pompéia, L., Hill, V., Spite, M., et al. 2008, A&A, 480, 379 [NASA ADS] [CrossRef] [EDP Sciences] [Google Scholar]
- Prantzos, N., Abia, C., Limongi, M., Chieffi, A., & Cristallo, S. 2018, MNRAS, 476, 3432 [Google Scholar]
- Prantzos, N., Abia, C., Cristallo, S., Limongi, M., & Chieffi, A. 2020, MNRAS, 491, 1832 [Google Scholar]
- Ramos, P., Antoja, T., Yuan, Z., et al. 2022, A&A, 666, A64 [NASA ADS] [CrossRef] [EDP Sciences] [Google Scholar]
- Reichert, M., Hansen, C. J., Hanke, M., et al. 2020, A&A, 641, A127 [NASA ADS] [CrossRef] [EDP Sciences] [Google Scholar]
- Riello, M., De Angeli, F., Evans, D., et al. 2021, A&A, 649, A3 [NASA ADS] [CrossRef] [EDP Sciences] [Google Scholar]
- Roederer, I. U., & Lawler, J. E. 2012, ApJ, 750, 76 [NASA ADS] [CrossRef] [Google Scholar]
- Romano, D., & Matteucci, F. 2007, MNRAS, 378, L59 [NASA ADS] [Google Scholar]
- Romano, D., Karakas, A. I., Tosi, M., & Matteucci, F. 2010, A&A, 522, A32 [NASA ADS] [CrossRef] [EDP Sciences] [Google Scholar]
- Ruiz-Lara, T., Gallart, C., Bernard, E. J., & Cassisi, S. 2020, Nat. Astron., 4, 965 [NASA ADS] [CrossRef] [Google Scholar]
- Sbordone, L., Bonifacio, P., Buonanno, R., et al. 2007, A&A, 465, 815 [NASA ADS] [CrossRef] [EDP Sciences] [Google Scholar]
- Seitenzahl, I. R., & Townsley, D. M. 2017, in Handbook of Supernovae, eds. A. W. Alsabti, & P. Murdin (Berlin: Springer), 1955 [Google Scholar]
- Sestito, F., Vitali, S., Jofre, P., et al. 2024, A&A, 689, A201 [NASA ADS] [CrossRef] [EDP Sciences] [Google Scholar]
- Siegel, M. H., Dotter, A., Majewski, S. R., et al. 2007, ApJ, 667, L57 [NASA ADS] [CrossRef] [Google Scholar]
- Siegel, D. M., Barnes, J., & Metzger, B. D. 2019, Nature, 569, 241 [Google Scholar]
- Skúladóttir, Á., Tolstoy, E., Salvadori, S., Hill, V., & Pettini, M. 2017, A&A, 606, A71 [NASA ADS] [CrossRef] [EDP Sciences] [Google Scholar]
- Smiljanic, R., Romano, D., Bragaglia, A., et al. 2016, A&A, 589, A115 [NASA ADS] [CrossRef] [EDP Sciences] [Google Scholar]
- Sneden, C., Cowan, J. J., & Gallino, R. 2008, ARA&A, 46, 241 [Google Scholar]
- Spitoni, E., Aguirre Borsen-Koch, V., Verma, K., & Stokholm, A. 2022, A&A, 663, A174 [NASA ADS] [CrossRef] [EDP Sciences] [Google Scholar]
- Stancliffe, R. J. 2021, MNRAS, 505, 5554 [NASA ADS] [CrossRef] [Google Scholar]
- Stetson, P. B., & Pancino, E. 2008, PASP, 120, 1332 [Google Scholar]
- Suda, T., Katsuta, Y., Yamada, S., et al. 2008, PASJ, 60, 1159 [NASA ADS] [Google Scholar]
- Tepper-García, T., & Bland-Hawthorn, J. 2018, MNRAS, 478, 5263 [CrossRef] [Google Scholar]
- Tinsley, B. M. 1979, ApJ, 229, 1046 [Google Scholar]
- Truran, J. W. 1981, A&A, 97, 391 [NASA ADS] [Google Scholar]
- Umeda, H., & Nomoto, K. 2002, ApJ, 565, 385 [Google Scholar]
- Van der Swaelmen, M., Hill, V., Primas, F., & Cole, A. A. 2013, A&A, 560, A44 [NASA ADS] [CrossRef] [EDP Sciences] [Google Scholar]
- Vitali, S., Arentsen, A., Starkenburg, E., et al. 2022, MNRAS, 517, 6121 [NASA ADS] [CrossRef] [Google Scholar]
- Vitali, S., Rojas-Arriagada, A., Jofré, P., et al. 2025, A&A, 699, A163 [NASA ADS] [CrossRef] [EDP Sciences] [Google Scholar]
- Winteler, C., Käppeli, R., Perego, A., et al. 2012, ApJ, 750, L22 [Google Scholar]
- Wood, M. P., Lawler, J. E., Sneden, C., & Cowan, J. J. 2014, ApJS, 211, 20 [NASA ADS] [CrossRef] [Google Scholar]
- Woosley, S. E., & Weaver, T. A. 1995, ApJS, 101, 181 [Google Scholar]
All the abundances are available in electronic format at the CDS.
All the abundance ratios and their uncertainties are available in electronic form.
These events represent a class of massive (>20 M) CC-SNe with ten times or more higher explosion energies relative to standard CC/Type II SNe (E = 1051 erg; e.g. Umeda & Nomoto 2002; Kobayashi et al. 2006). They are often associated with long gamma-ray burst progenitors (Nomoto et al. 2013 and references therein).
All Tables
Sagittarius spectroscopic targets: photometric data, atmospheric parameters, [Fe/H], and RVs.
All Figures
|
Fig. 1 Positions of the spectroscopic targets on the Gaia DR3 colourmagnitude diagram of Sgr dSph (only Sgr stars outside the tidal radius of M54 are shown), colour-coded according to their [Fe/H]. The triangles are the targets already discussed in Minelli et al. (2021), while the squares are the new targets. |
| In the text | |
|
Fig. 2 Examples of spectra for three target stars with different [Fe/H]. Some lines of interest are labelled. |
| In the text | |
|
Fig. 3 Kiel diagram showing the run of log g as a function of Teff for the Sgr spectroscopic targets (same symbols as in Fig. 1). |
| In the text | |
|
Fig. 4 Behaviour of [Fe/H] as a function of RV for the spectroscopic dataset discussed here (same symbols as in Fig. 1) in comparison with the sample of Sgr stars by Minelli et al. (2023). |
| In the text | |
|
Fig. 5 Positions in the colour-magnitude diagram of the Sgr targets with [Fe/H]>-0.7 dex, superimposed on some BaSTI-IAC isochrones (Pietrinferni et al. 2021) with [Fe/H]=−0.6 and −0.4 dex solar-scaled chemical mixtures (red and blue curves, respectively) and ages of 1, 4, and 11 Gyr. |
| In the text | |
|
Fig. 6 Behaviour of [Na/Fe] and [Al/Fe] as a function of [Fe/H] for the Sgr spectroscopic targets of this study (same symbols as in Fig. 1), in comparison with the abundances of MW GCs analysed by Mucciarelli et al. (2023b, orange star symbols) and with the MW field stars from the SAGA database (Suda et al. 2008, grey circles). The empty red squares are the metal-rich Sgr targets belonging to the blue side of Sgr RGB (see Section 4). The typical errorbar of the abundance ratios measured for Sgr stars is shown in the bottom left corner. |
| In the text | |
|
Fig. 7 α-elements (O, Mg, Si, Ca, and Ti) abundance ratios as a function of [Fe/H]. The symbols are the same as in Fig. 6. |
| In the text | |
|
Fig. 8 Behaviour of the average hydrostatic [α/Fe] as a function of [Fe/H] for the Sgr stars (same symbols as in Fig. 7) in comparison with stars of the LMC (Van der Swaelmen et al. 2013; Lapenna et al. 2012), the SMC(Mucciarelli et al. 2023a), Fornax (Letarte et al. 2010), and Sculptor (Hill et al. 2019). The [α/Fe] is computed by averaging [O/Fe] and [Mg/Fe]. |
| In the text | |
|
Fig. 9 Behaviour of [Sc/Fe], [V/Fe], [Cr/Fe], and [Mn/Fe] as a function of [Fe/H]. The symbols are the same as in Fig. 6. |
| In the text | |
|
Fig. 10 Behaviour of [Zr/Fe], [Ba/Fe], [La/Fe], [Nd/Fe], and [Eu/Fe] as a function of [Fe/H]. The symbols are the same as in Fig. 6. |
| In the text | |
|
Fig. B.1 Comparison between this study (red symbols) and Hasselquist et al. (2021, green circles). |
| In the text | |
Current usage metrics show cumulative count of Article Views (full-text article views including HTML views, PDF and ePub downloads, according to the available data) and Abstracts Views on Vision4Press platform.
Data correspond to usage on the plateform after 2015. The current usage metrics is available 48-96 hours after online publication and is updated daily on week days.
Initial download of the metrics may take a while.